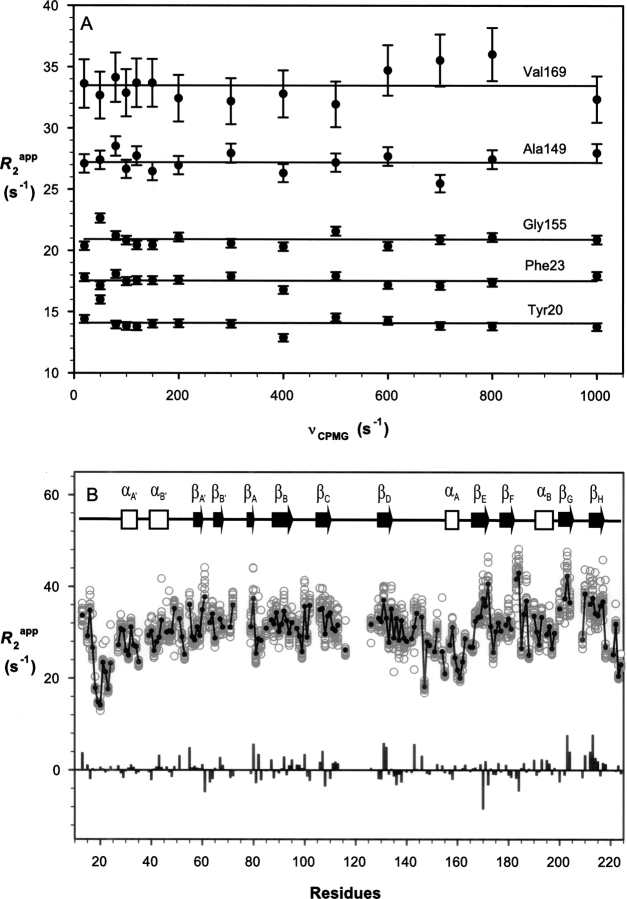
Figure 5.
15N relaxation dispersion of SSB-2 (12–224) measured at CPMG field strengths ranging from 20 to 1000 sec−1. (A) R 2 app as a function of the CPMG field strengths for residues Tyr20, Phe23, Ala149, Gly155, and Val169. (B) Distribution of R 2 app values as measured at CPMG field strengths ranging from 20 to 1000 sec−1 versus SSB-2 residue number (○) with the solid line connecting consecutive residues through their averaged values (•) of R2 app. Values of ΔR 2 app = R 2 app (20 sec−1) − R 2 app (1000 sec−1) are shown as the bar chart.

