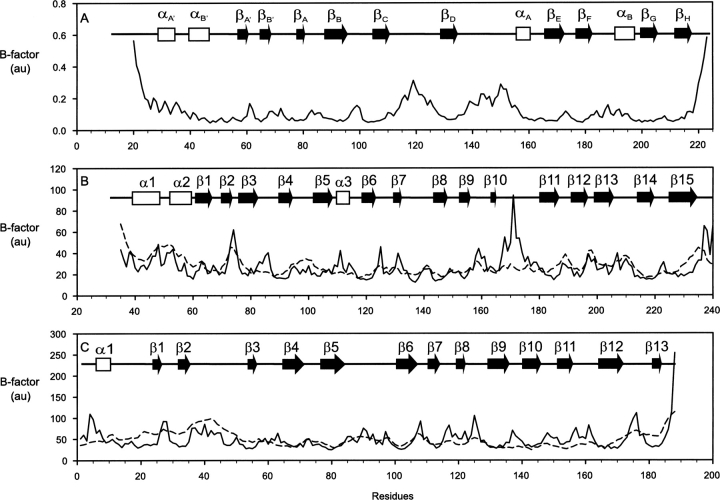
Figure 6.
Relative residue fluctuations (temperature factors, solid lines) for the overall normal modes of motions for SSB-2 (A), GUSTAVUS (B), and PRYSPRY (C). Schematic diagrams of secondary structure elements of each molecule are shown inside each panel. For comparison, the experimental B-factors of Cα values are shown as dashed lines for GUSTAVUS and PRYSPRY.

