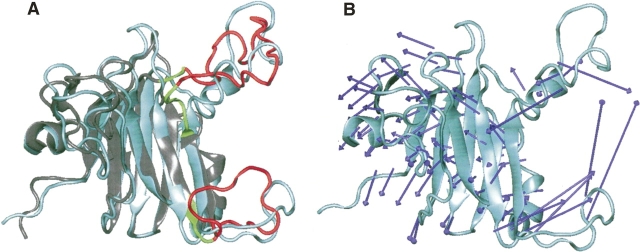
Figure 7.
(A) Dominant motion and possible dynamical internal subdomains of SSB2. (Cyan) The reference structure as of closest-to-mean of SSB-2; (gray) a random structure (i.e., model 10); (red) the motional internal subdomain; (green) the bending residues shown to be important for internal subdomain motion and SSB-2 interactions with c-Met and Par-4. (B) Force vectors (blue arrows, indicating direction and amplitude of acting forces on residues) of the dominant mode motion from normal mode analysis of SSB2, where cyan indicates the closest-to-mean state of SSB-2. These diagrams were prepared using Visual Molecular Dynamics (VMD) (Humphrey et al. 1996).

