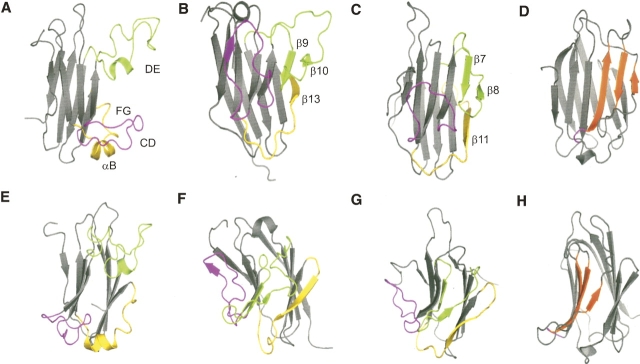
Figure 8.
Ribbon diagrams showing the β-sheet core of the B30.2/SPRY domain–containing proteins SSB-2 (residues 72–220, A,E), GUSTAVUS (residues 82–238, B,F), and PRYSPRY (residues 45–188, C,G), with characteristic loop/β-strand regions highlighted and labeled. E–G are the same as A–C after a near 90° rotation around the vertical axis, to show the relative position of the loop CD (SSB-2) and corresponding region of GUSTAVUS and PRYSPRY against the β-sandwich core. (D,H) Ribbon diagrams of galectin-3 (PDB 1A3K) (Seetharaman et al. 1998) with the short loop corresponding to loop CD in SSB-2 highlighted in purple as in A–C. Strands involved in lactose and N-acetyllactosamine binding are highlighted in orange. This diagram was created using the program PyMOL (DeLano 2004; http://pymol.sourceforge.net).

