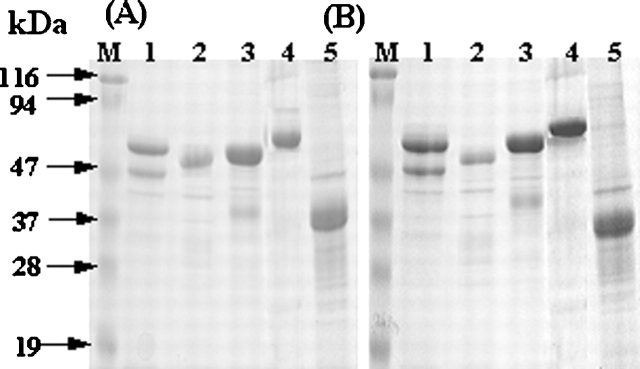
Figure 4.
Representative reducing (A) and nonreducing (B) SDS-PAGE analysis of the recovered soluble proteins from IBs (1 mg/mL) by HHP (200 MPa, 25°C, 24h) in the refolding buffer. GNBP1 (lane 1); GNBP2 (lane 2), GNBP3 (lane 3), PTPRS (lane 4), and DUSP7 (lane 5). The gels were stained with Coomassie blue.

