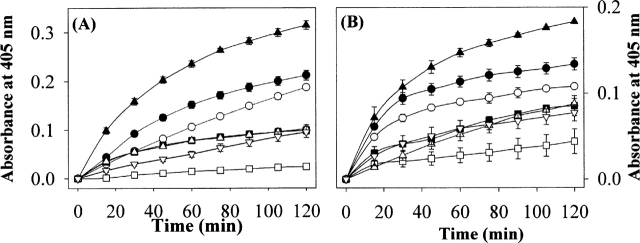
Figure 6.
The phosphatase activity assay of the recovered soluble PTPRS (A) and DUSP7 (B) from IBs (1 mg/mL) by HHP (200 MPa, 25°C, 24 h) in the refolding buffer containing the additives. The enzymatic activity was monitored by the p-NPP hydrolysis assay as described in detail in the Materials and Methods section. The symbols represent the following buffer conditions: (○) buffer; (•) 1 M urea; (□) 2 M urea; (▪) 2.5 M glycerol; (▴) 0.5 M arginine; (▵) 0.1 mM Tween 20; (▿) 0.5 mM Triton X-100. The error bars represent the standard deviation for triplicate incubated samples.

