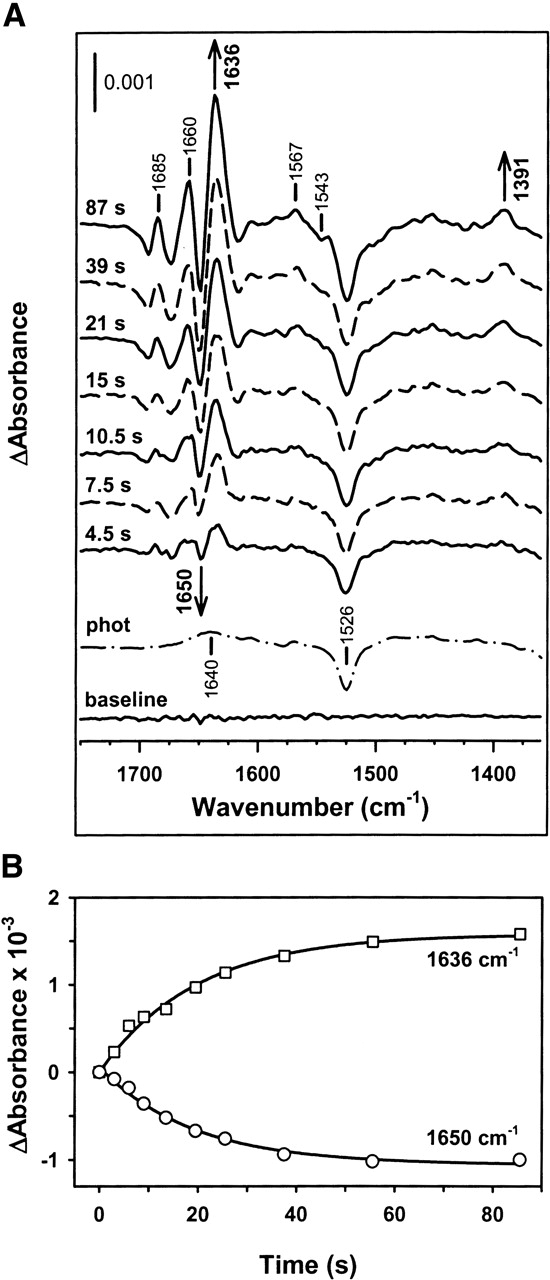
Figure 2.

ATP binding to DnaK induces absorbance changes in the protein IR spectrum. (A) Time dependence of the IR difference spectrum of DnaK during the first 2 min after ATP release to an ADP-saturated DnaK sample. The final ATP/protein molar ratio was ~1. Protein concentration was 1.4 mM, the buffer was prepared in H2O, and measurements were carried out at 25°C. For the purpose of comparison, a baseline spectrum recorded with the protein sample and without flash (baseline) and the photolysis spectrum (phot) measured without protein are also shown. Average of 13 independent experiments. (B) Kinetics of the absorbance changes at 1650 cm−1 (circles) and 1636 cm−1 (squares), corresponding to the spectra depicted in A. The best fits obtained with single exponentials are shown in solid lines.
