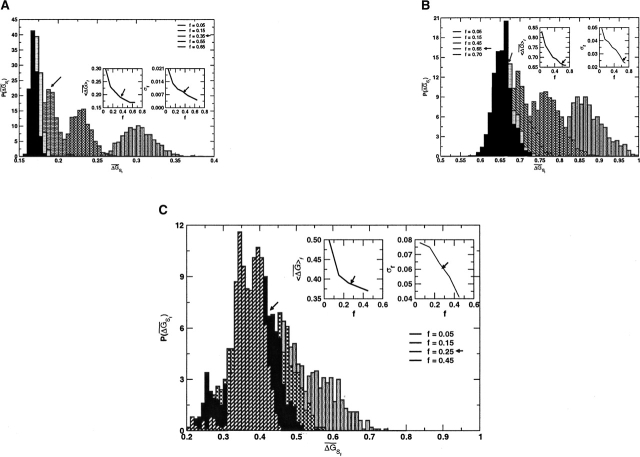
Figure 1.
Distribution of  λ for various sizes (
 ) of subalignments for the GPCR, globin, and Lectin families. The index λ refers to the one of the subsets with NS sequences. Insets show the dependence of 〈
 〉f and σf for various f. As expected from Equation 6, 〈
 〉f shows a plateau starting at a given value of f (indicated by the arrow), while σf for f larger than this value decreases according to Equation 7. The minimum size of f should correspond to the value indicated by the arrow. (A) GPCR family (940 sequences in full MSA). (B) Globin family (880 sequences in full MSA). (C) Lectin C family (1126 sequences in full MSA).

