
Figure 3.
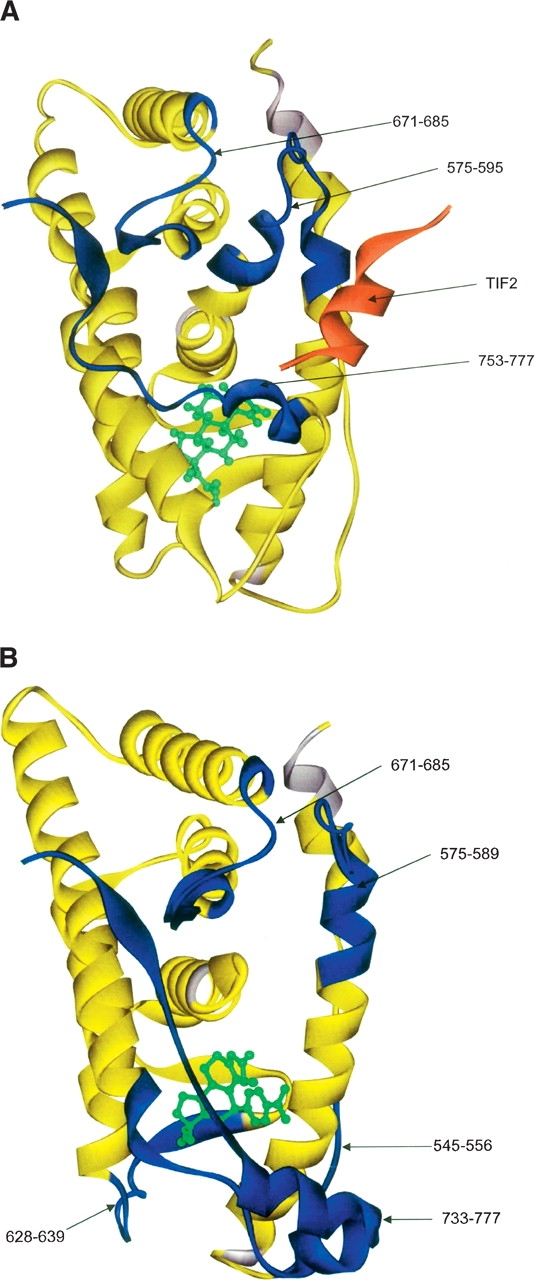
(A) This figure shows the alteration of exchange rates produced by TIF2 binding to GR LBD/dexamethasone mapped onto the crystal structure of GR LBD/dexamethasone. Regions colored in blue show decreased exchange (increased protection) upon TIF2 binding. (B) This figure shows the alteration of exchange rates produced by NCoR binding to GR LBD/RU-486 mapped onto the crystal structure of GR LBD/RU-486. Regions colored in blue show decreased exchange (increased protection) upon NCoR binding.