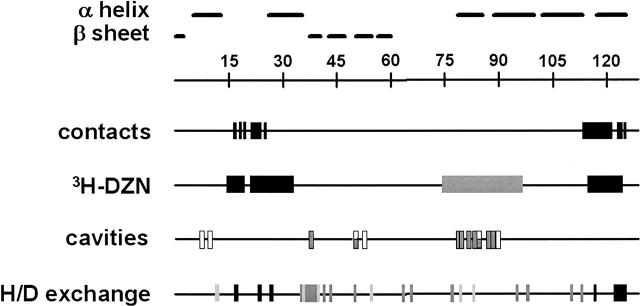
Figure 4.
Linear diagram of HEWL. Numbers on the ruler represent positions along the amino acid sequence of HEWL. Horizontal bars indicate known secondary structure elements based on crystallographic data. Black boxes along the line contacts point to amino acid residues that are in direct contact with the MAb D1.3, as revealed by the structure of the complex (Fischmann et al. 1991). The line 3H-DZN shows peptides C1, C2, and C3 (black boxes), for which the largest relative differential labeling was measured, and peptide A (gray box), exhibiting the second largest value of this parameter (see Fig. 2c). The line cavities displays the positions of amino acid residues that constitute the boundaries of cavities 1 (white boxes) and 2 (gray boxes). These entities were conspicuously found in all high-resolution structures analyzed. The line H/D exchange represents graphically the experimentally measured protection factors (defined as τ complexed HEWL/τ free HEWL for each amino acid residue, τ being the lifetime of exchange of the amide proton) (see Williams et al. 1996). Boxes in shades of gray illustrate the values of this parameter according to its magnitude: black (>3), dark gray (between 2 and 3) and light gray (between 1 and 2).

