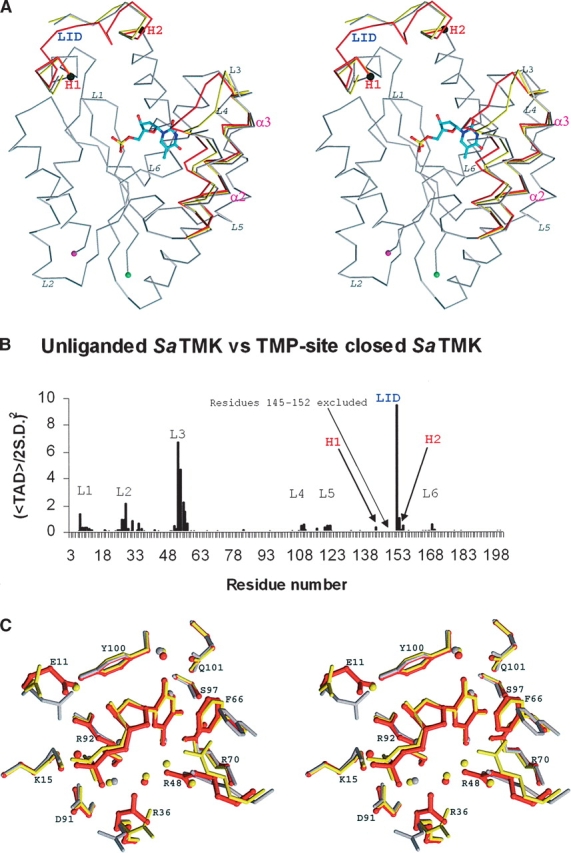
Figure 3.

TMP-induced conformational change of SaTMK. (A) Stereo view of the alignmentof Cα traces of unliganded SaTMK (gray); TMP site partially closed SaTMK (yellow) and TMP site closed SaTMK (red). The N and C termini are indicated by green and by magenta spheres, respectively. The helices α2and α3 are labeled in magenta. Hinge points of the LID regions (labeled in blue) as identified with TAD analysis are drawn as black spheres and labeled in red. Flexible loops with torsion angle differences identified by TAD analysis are labeled in italics. (B) TAD plot of comparison of torsion angles between unliganded and TMP site closed SaTMK. The significant TAD peaks are labeled in black and correspond to the loops in A. The LID region is labeled in blue. The hinge points of the LID region are labeled as H1 and H2 in red. (C) Close-up stereo view of TMP-binding site. Residues are drawn in gray for unliganded SaTMK, in yellow for the SaTMK with partially closed TMP site, and in red for TMP site closed SaTMK.
