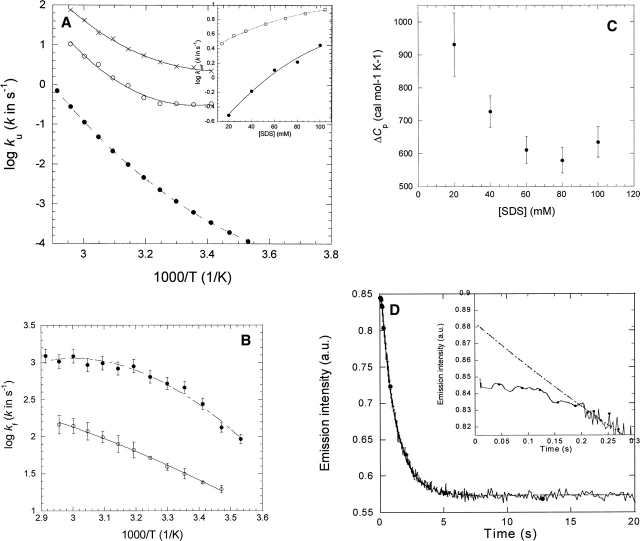
Figure 2.
(A) Temperature dependence of unfolding of S6 in 0 molar GdmCl (•) (data from Otzen and Oliveberg 2004) and in 20 mM SDS (○) and 100 mM SDS (×). Data fitted to Equation 3 and summarized in Table 1. (Inset) ku as a function of SDS concentration in 20 mM Tris (pH 8) (○) and 100 mM NaCl (data from Otzen 2002) and in PN buffer in the presence of 5 mM DM (•). Data are fitted to a second order polynomial. (B) Temperature dependence of refolding of S6 from SDS into DM (○) and at 0 molar GdmCl (•) (data from Otzen and Oliveberg 2004). Data fitted to Equation 3 and summarized in Table 1. (C) Variation of heat capacity of unfolding of S6 in SDS with SDS concentration in the presence of 5 mM DM. For each SDS concentration and temperature, the unfolding rate constant was interpolated from second order polynomials (see inset in A). (D) Time profile of unfolding of S6 into 20 mM SDS and 5 mM DM at 45°C. The inset highlights the 0.2-sec lag phase. The line represents the best fit of the data after 0.2 sec to a single exponential decay with drift.

