
Figure 2.
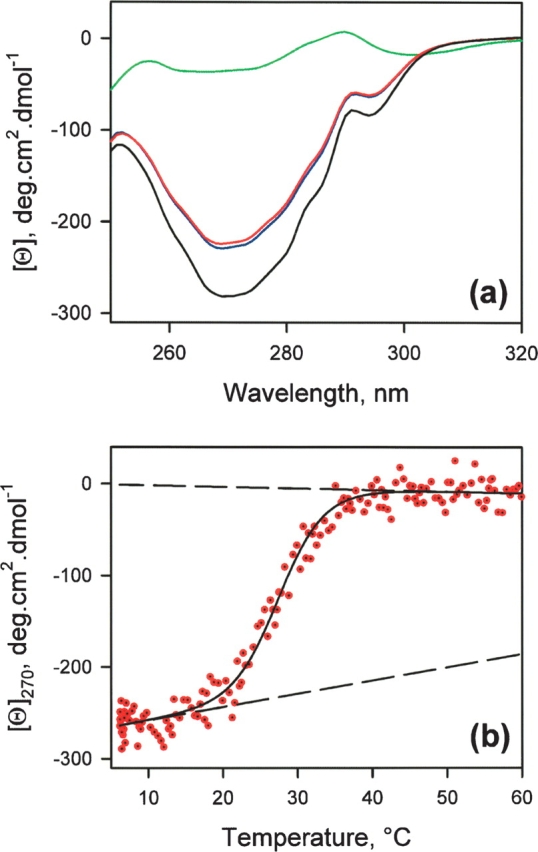
(a) Near-UV CD spectra of BLA in the presence of 100 mM Tris-HCl at 20°C: (black line) in the presence of 30 mM CaCl2, (red line) in the presence of 1mM EDTA, (blue line) in the presence of 1 mM EGTA, (green line) the MG-state at pH 2. (b) Thermal unfolding of the apo-form of BLA in the presence of 100 mM Tris-HCl and 1 mM EDTA monitored at 270 nm. The continuous line corresponds to the best fit of the data, as described in Materials and Methods. The thermodynamic parameters are ΔHVH = 248.5 kJ/mol and Tm = 27.8°C. The dashed lines illustrate the pre- and post-transitional dependencies of the CD signal.