
Figure 4.
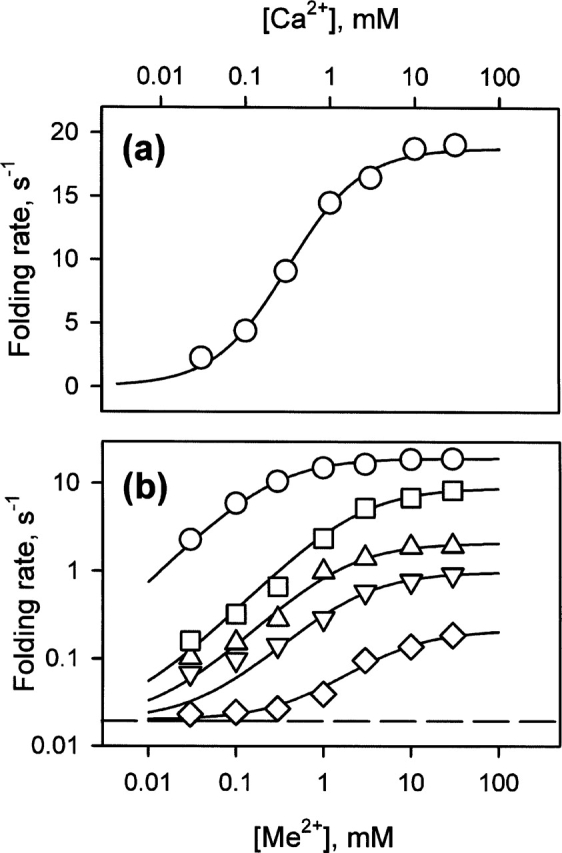
Folding rate dependencies. (a) Ca2+ dependence of the folding rate. (b) Metal ion dependence of the folding rates: (circles) Ca2+, (squares) Sr2+, (triangles) Mn2+, (inverted triangles) Ba2+, and (diamonds) Mg2+. The folding rate of the apo-form is marked by a dashed line. The continuous lines correspond to the best fits used to extract the dissociation constants of the MG- and T-states (given in Table 1), as described in Materials and Methods. The experimental errors are within the size of the symbols.