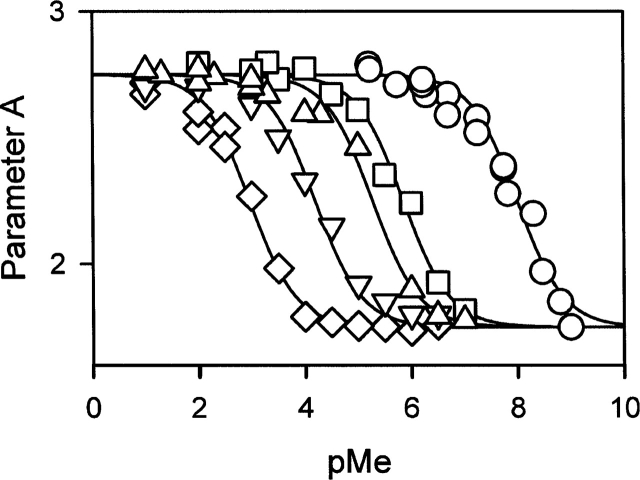
Figure 5.
Binding curves of the different metal ions: (circles) Ca2+, (squares) Sr2+, (triangles) Mn2+, (inverted triangles) Ba2+, and (diamonds) Mg2+. pMe = −log[Me2+], where Me2+ designs the various metal ions used. The continuous lines correspond to the best fits of the data to the binding equation, as described in Materials and Methods. The dissociation constants are given in Table 1.

