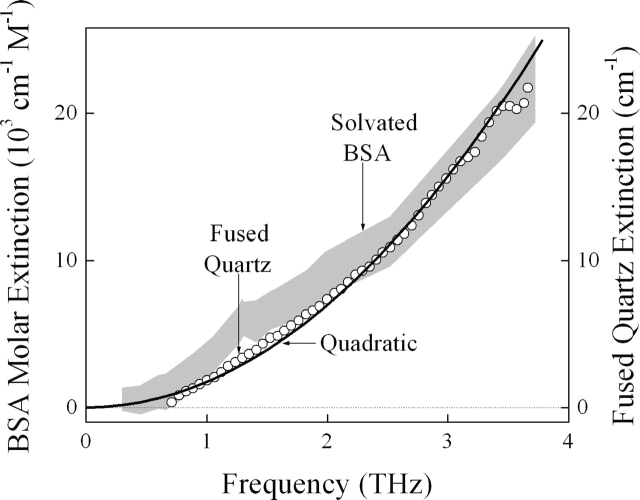
Figure 6.
The shape of the BSA spectrum closely resembles that of the previously published terahertz spectrum of fused quartz (○) (Parker et al. 1977) and an ideal quadratic spectral density expected for a disordered ionic solid (Kittle 1996). The spectrum of the low-lying vibrational modes of the native BSA protein may be modeled, to first order, as a three-dimensional, elastic nanoparticle with aperiodic charge distribution. Small but significant departures from the simple quadratic behavior of a disordered solid are, however, observed for the solvated protein. These deviations are presumably the spectral signatures arising from the unique molecular details of the solvated BSA.

