
Figure 7.
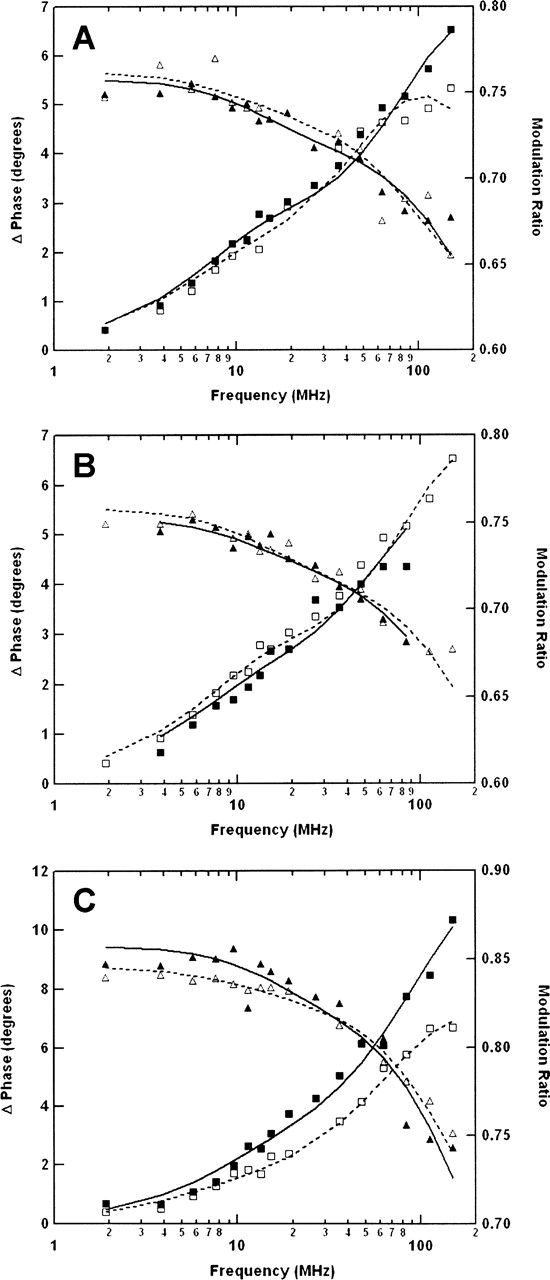
Frequency domain anisotropy decay analysis of CEDANS-conjugated EGFR-ICD proteins. The rotational dynamics of the C-terminal fluorophore in the EGFR-ICD–CEDANS and EGFR-ΔCT–CEDANS proteins (0.5 μM) were analyzed by multifrequency phase/modulation fluorescence anisotropy measurements (see Materials and Methods). Shown are representative phase (□, ▪) and modulation (△, ▴) data for the proteins under various conditions. (A) EGFR-ICD–CEDANS protein incubated in the presence of 1 mM MnCl2 (□, △) or phosphorylated in the presence of 1 mM MnCl2 and 100 μM ATP (▪, ▴). (B) EGFR-ICD–CEDANS phosphorylated in the presence of 1 mM MnCl2 and 100 μM ATP without (□, △) or with (▪, ▴) the subsequent addition of 1 μM recombinant GST–SH2 protein. (C) Comparison of EGFR-ICD–CEDANS (□, △) and EGFR-ΔCT–CEDANS (▪, ▴) proteins. Fitting of these data with a two-component anisotropy decay model yielded the parameters given in Table 2.