
Figure 2.
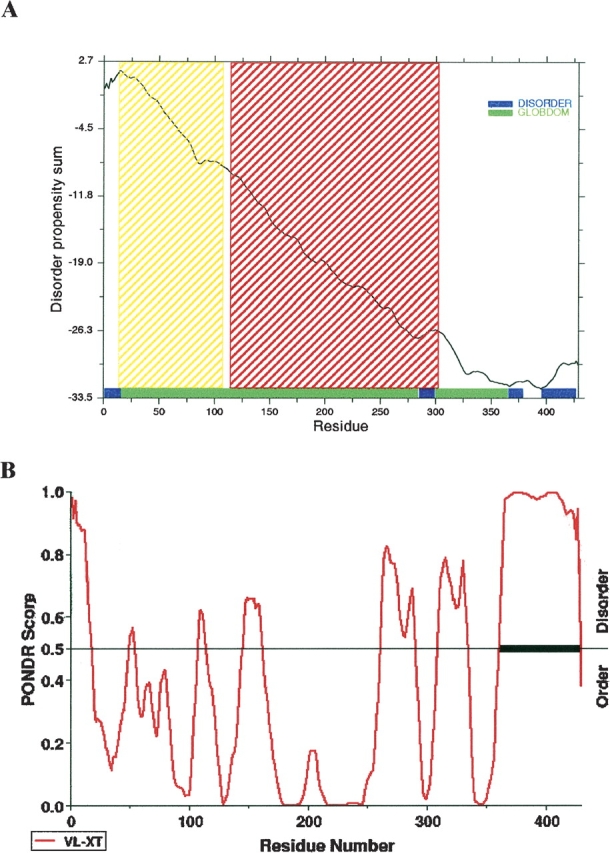
Sequence prediction of unstructured regions. (A) GlobPlot: The disorder propensity score is plotted against residue number. Residue ranges predicted for globular and disordered segments are indicated by green and by blue bars, respectively. Shaded regions (yellow and red) correspond to the substrate- and nucleotide-binding domains of CtBP3, predicted on the basis of its sequence similarity to D-2-hydroxyacid-specific NAD-dependent dehydrogenases (SMART/Pfam prediction: http://smart.embl.de). (B) PONDR: The prediction score is plotted against residue number. Residues with a score above a threshold of 0.5 are considered disordered. The disordered C-terminal region is marked by a thick bar.