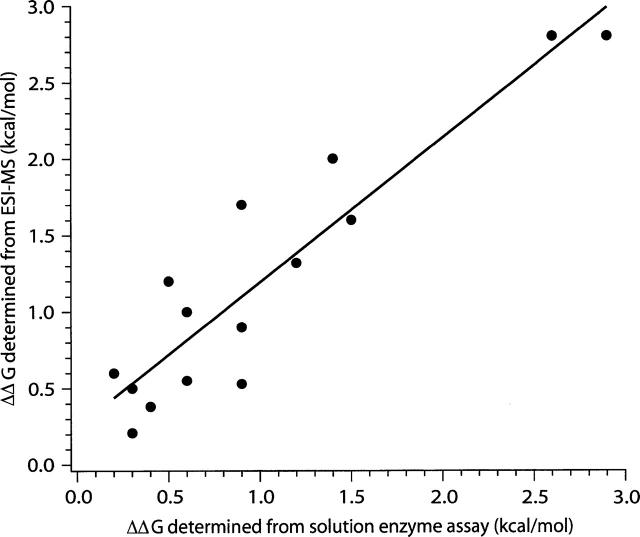
Figure 7.
A plot of the ΔΔG determined from ESI-MS vs. ΔΔG obtained from the barnase activity assay (the data are in Table 2). A least-squares linear fit (solid line) shows good correspondence between the data, with a slope of 0.9 ± 0.1 and a y-intercept of 0.30 ± 0.14, with R2 = 0.85.

