
Figure 5.
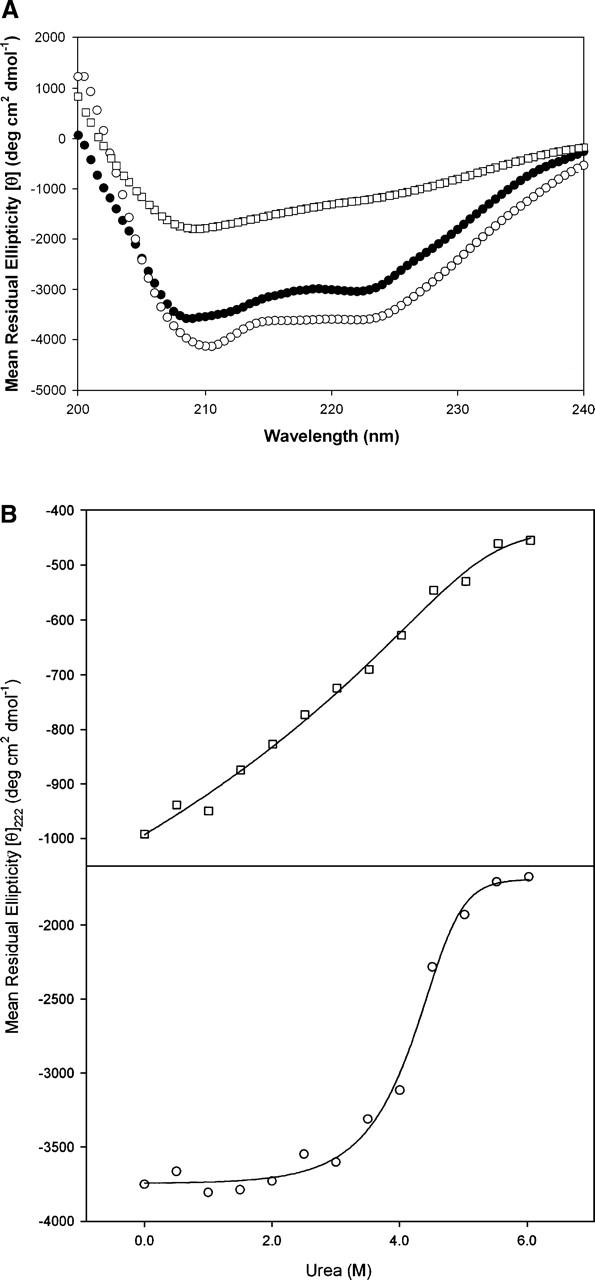
(A) Circular dichroism spectra of Rel WT (•) compared with that of Rel NTD (○) and Rel CTD protein (□), showing that the Rel CTD protein is largely unstructured. The Y-axis represents the mean residual ellipticity. (B) Urea denaturation profiles of Rel CTD (□) and Rel NTD (○). The proteins were denatured with increasing concentrations of urea. The Y-axis represents the mean residual ellipticity at 222 nm.