
Figure 9.
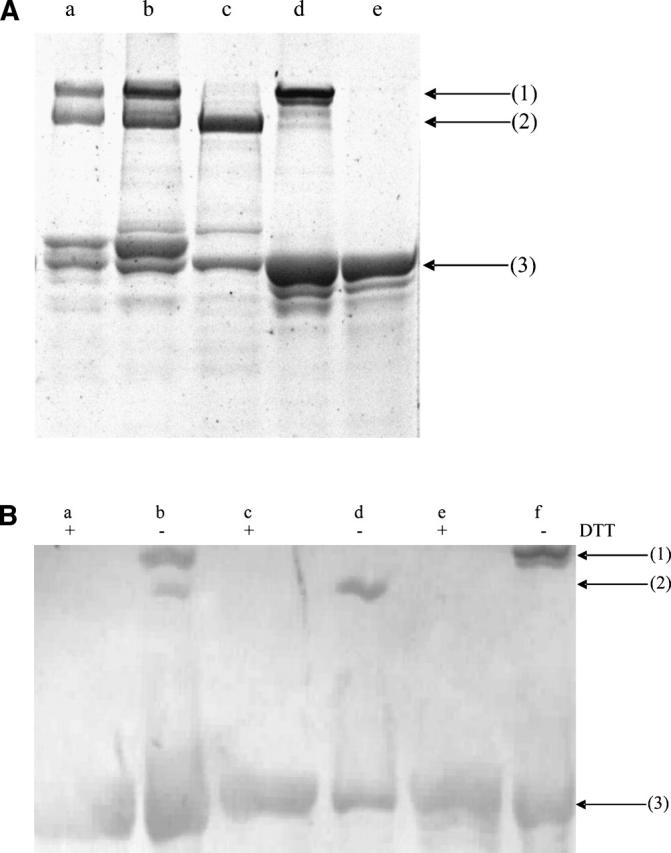
(A) An 8% SDS-PAGE showing Rel full-length protein with different cysteine mutants. (Lane a) Rel WT; (lane b) Rel C666S, C667S; (lane c) Rel C492S, C666S, C667S; (lane d) Rel C666S, C667S, C692S; (lane e) Rel C492S, C666S, C667S, C692S. All of the proteins were run under denaturing conditions in the absence of DTT. Arrows at 1 and 2 indicate the position of dimers with different mobilities. Arrow at 3 indicates the mobility of monomer. (B) Western analysis of the cysteine mutants. The proteins were run in the presence and the absence of DTT. (Lanes a, b) Rel C666S, C667S; (lanes c, d) Rel C492S, C666S, C667S; (lanes e, f) Rel C666S, C667S, C692S. “+” represents the presence of DTT, whereas “−” represents its absence. Arrows at 1 and 2 indicate the position of dimers with different mobilities. Arrow at 3 indicates the mobility of monomer.