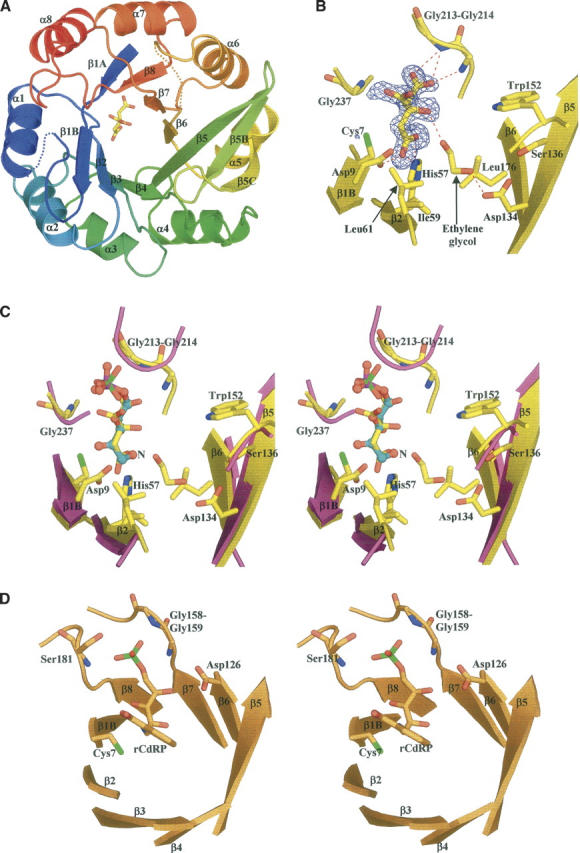
Figure 2.

(A) Ribbon representation of His6 colored from blue (Nter) to red (Cter) with the bound citrate molecule shown as sticks. (B) View of citrate modeled into the residual Fo−Fc electron density map contoured at 3.5σ. Hydrogen bonds between citrate, ethylene glycol, and His6 are depicted by red dashed lines. (C) Stereo view representation of the active sites of Tm HisF (magenta; PDB code 1GPW) and the S. cerevisiae His6 (yellow). For clarity, only the active site is shown. The phosphate ion (phosphorus atom in green) bound to the HisF enzyme is shown as sticks. The citrate molecule bound to yeast His6 and a model for the D-ribulose-5-phosphate moiety of the His6 product, are shown in sticks (carbon atoms in yellow) and ball-and-sticks (carbon atoms, blue; phosphorus atom, magenta), respectively. The nitrogen position of the N-(5′-phospho-D-ribosylformimino) is indicated by capital N. (D) Stereo presentation of the active site of TrpF bound to the reaction product.
