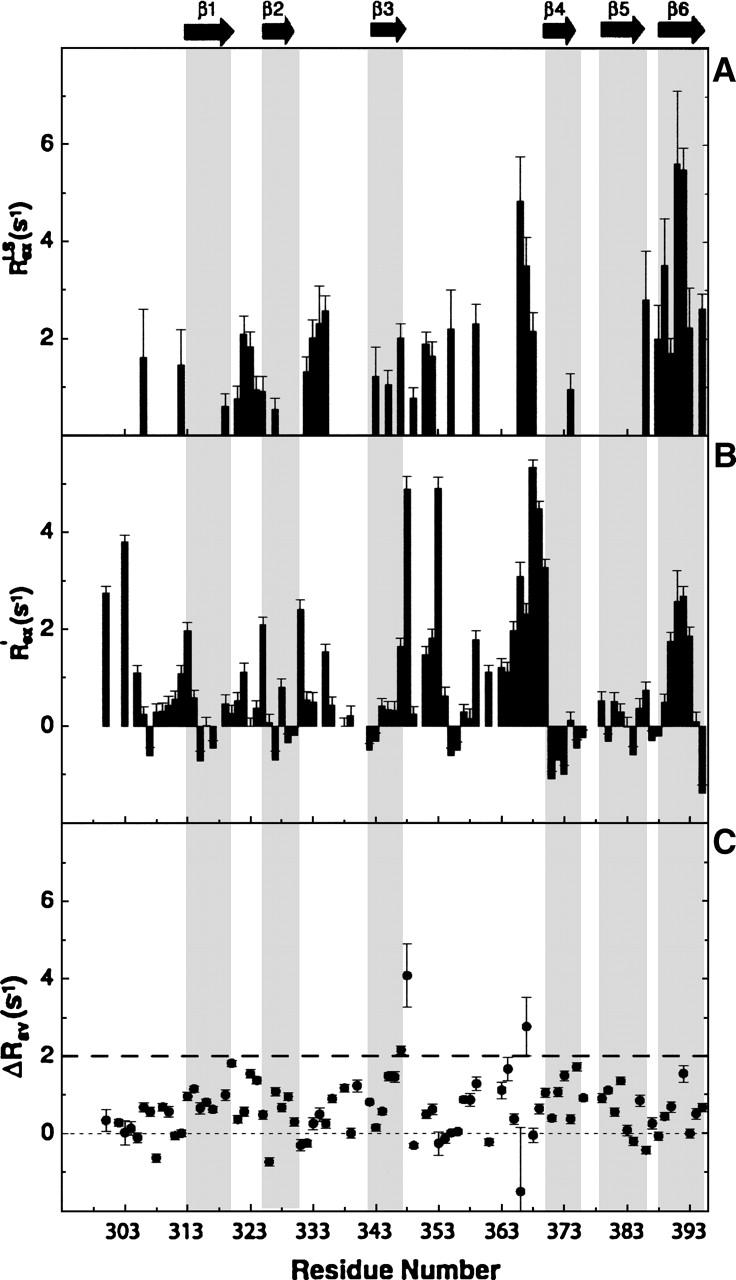
Figure 4.

Residues showing conformational exchange. (A) Residues that show Rex value in the Lipari-Szabo analysis, and (B) those obtained from cross-correlation relaxation rates of 15N CSA and 15N–1H dipolar interactions are shown. (C) Rav2 values calculated from the relaxation compensated CPMG experiment.
