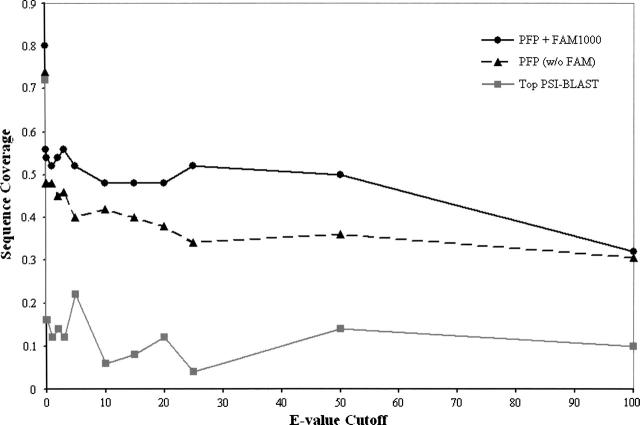
Figure 1.
Sequence coverage of PFP versus top PSI-BLAST. The sequence coverage (Y-axis) is the percentage of sequences for which a correct biological process (sharing a common parent with a target annotation at a GO depth ≥ 4) was ranked in the top five results output by PFP. The E-value cutoff value (X-axis) represents the minimum similarity for sequences used by PFP in our benchmark analysis. PFP + FAM1000 (solid black line) is PFP with associations scored by the FAM1000 matrix. PFP (w/o FAM) (broken black line) is PFP without scored associations. Top PSI-BLAST (solid gray line) transfers annotations from the most similar sequence scoring above each E-value cutoff.

