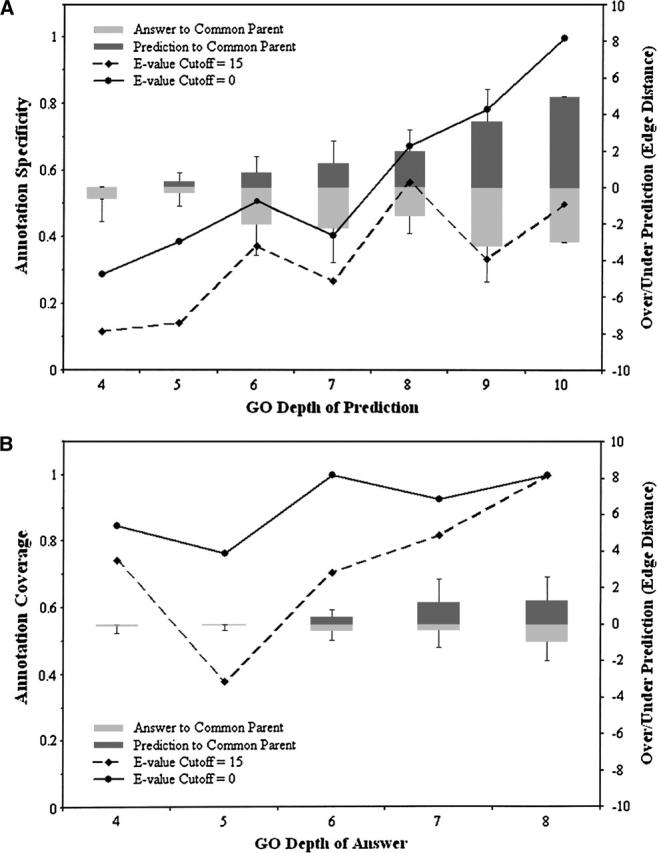
Figure 2.

Annotation-level accuracy of PFP at different GO depths. (A) The specificity (percentage of predicted annotations sharing a common parent with a target annotation at a GO depth ≥ 4) is shown at each GO depth of predicted annotation. The overprediction distance (dark gray columns, right-hand axis) is the average edge distance between a predicted annotation and the common parent it shares with the closest target annotation; the underprediction distance is the average edge distance between a target annotation and the common parent (light gray columns). The GO depth is the edge distance between each predicted (top) or target (bottom) annotation and the category root. (B) The coverage (percentage of correctly predicted target annotations) is shown at each GO depth of the correct annotation. The overprediction distance (dark gray columns, right-hand axis) is the average edge distance between each target annotation and the common parent it shares with the closest predicted annotation; the underprediction distance is the average edge distance between the closest predicted annotation and the common parent (light gray columns). For both A and B, “E-value Cutoff = 0” (solid black line) is PFP + FAM1000 and “E-value Cutoff = 15” (broken black line) is PFP + FAM1000 using only sequence hits from PSI-BLAST with an E-value of 15 or larger.
