Figure 3.
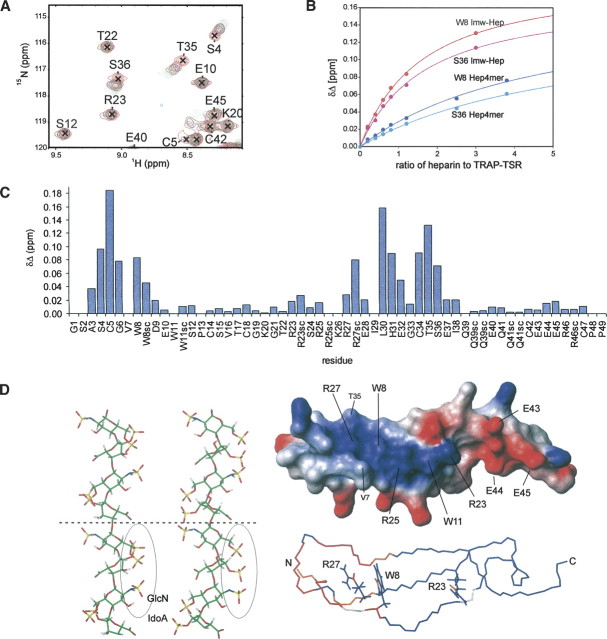
Characterization of the heparin binding site of TRAP-TSR. (A) A section of the overlaid 2D 1H, 15N-HSQC spectra acquired at different heparin titration points of TRAP-TSR. The concentration of heparin grows in the order 0:1 (red), 0.2:1 (yellow), 0.4:1 (magenta), 0.6:1 (black), 0.8:1 (orange), and 1.2:1 (green). (B) Binding curves for two residues for low-molecular-weight heparin and heparin tetrasaccharide. (C) A graph representing the chemical shift changes per residue for the low-molecular-weight heparin, at a heparin to TRAP-TSR ratio of 1.2:1. Also, the changes occurring in Arg, Trp, and Gln side chains are reported. (D) Illustration of the relation of the chemical shift perturbations to surface charge distribution and to the potential binding site on heparin. At the left, two solution conformations of heparin (Mulloy et al. 1993; PDB code 1HPN) are shown. In the leftmost structure IdoA has the 2S0 conformation, and in the middle structure the 1C4 conformation. IdoA and GlcN code for α-L-iduronic acid and α-D-glucosamine. Two tetrasaccharide units are shown, separated by a dashed line. The binding epitope, formed by the negative cluster of three sulfate groups in successive monosaccharides, is circled. The largest distance between sulfate oxygens is found in the 1C4 conformation, and is ∼10.7 Å. In the upper right structure the charge distribution of the surface of TRAP-TSR is shown, where blue indicates positive and red indicates negative partial charges. The positively charged cluster has approximate dimensions of 15.3 × 13.3 Å, from the average distance in the ensemble of structures between side chain Nɛ atoms of R23 and R27 and that between side chain methyl groups of V7 and T35. In the lower right structure, residues whose Δδ ≥ 0.05 ppm at a titration ratio 1:1.2 of TRAP-TSR to heparin are colored in red, and those with 0.02 < Δδ < 0.05 ppm in orange. Residues whose amide groups were not observed due to overlap are shown in white. Residues G1–S2 and P48–P49 are omitted for clarity.

