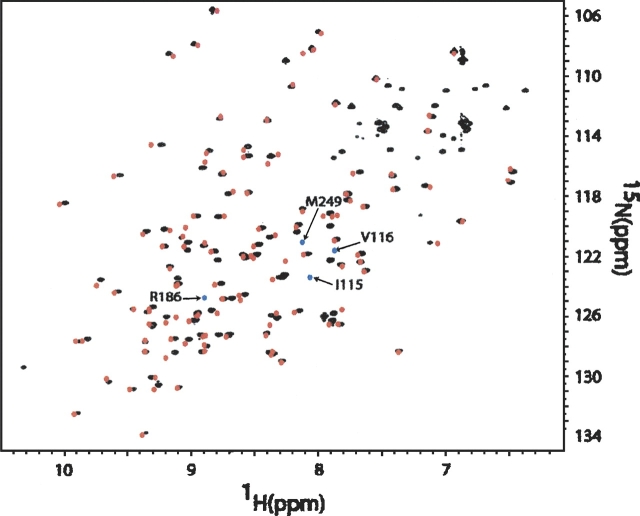
Figure 2.
Overlay of the 1H-15N HSQC spectrum of Galectin-3 C251-CRD (amino acids 114–251) (black) with the native Galectin-3 CRD (red). The spectrum of Galectin-3 C251-CRD was collected at 800 MHz, as a 1 mM sample in phosphate buffer at pH 7.4. The spectrum of the native Galectin-3 CRD was reconstructed based on the deposited chemical shifts from BMRB (accession no. 4909). Amino acids 108–113 were not plotted here for easy comparison. The blue points represent peaks where no partner can be found.

