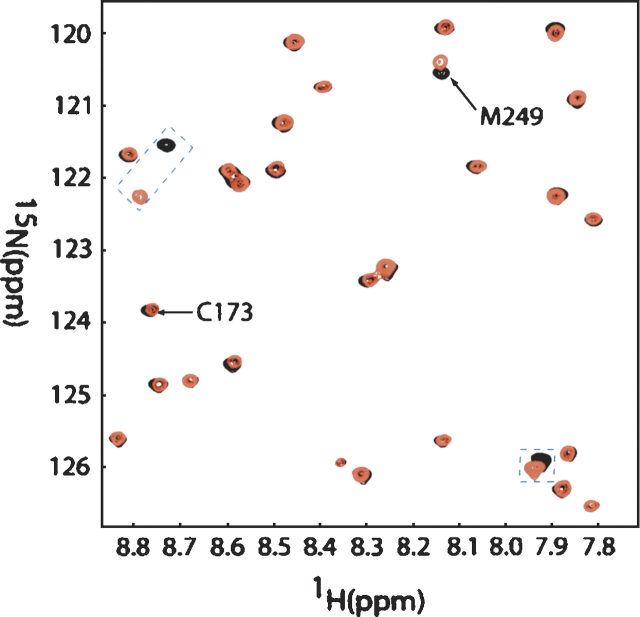
Figure 4.
Overlay of the 1H-15N HSQC spectra of 1 mM Galectin-3 C251-CRD (red) on spectra of Galectin-3 S-propyl-C251-CRD (black) in 75 mM phosphate buffer (pH 7.4). Spectra recorded at 25°C with a 1H resonance frequency of 800 MHz. C173 chemical shift remains unchanged. Three peaks (blue squares) were observed to have chemical shift changes where M249 shows a small degree of chemical shift variance and the other two were new peaks after the addition of C251.

