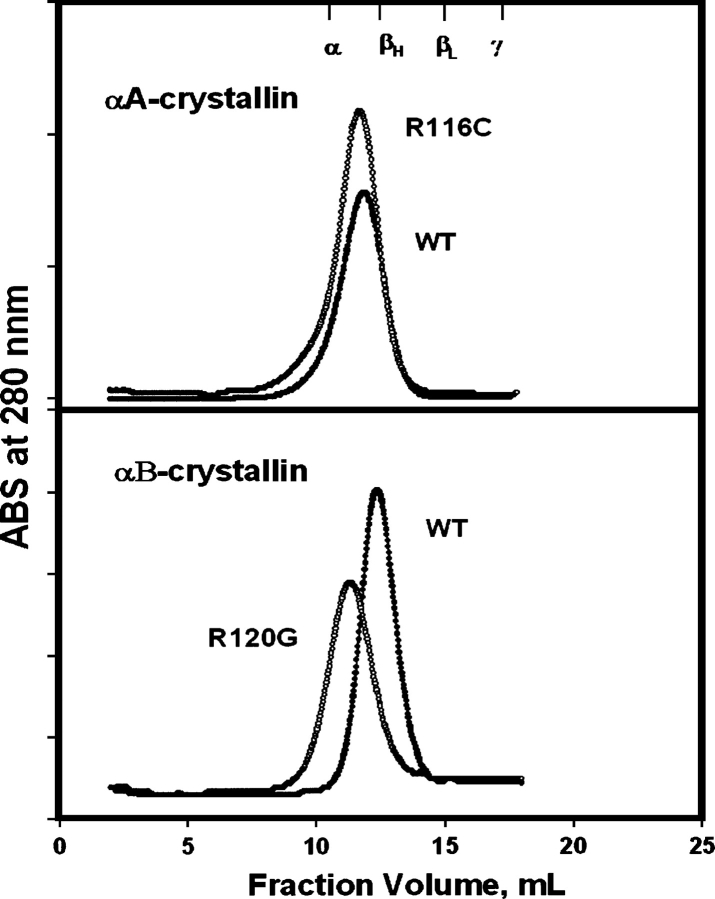
Figure 2.
FPLC size exclusion chromatography of R116C αA- (top) and R120G αB-crystallin (bottom) on Superose 6 column: protein concentrations at 0.5–1.0 mg/mL and flow rate at 0.5 mL/min. The markers indicated in the upper X-axis are from the profile of calf lens soluble proteins (α-, βH-, βL-, and γ-crystallin).

