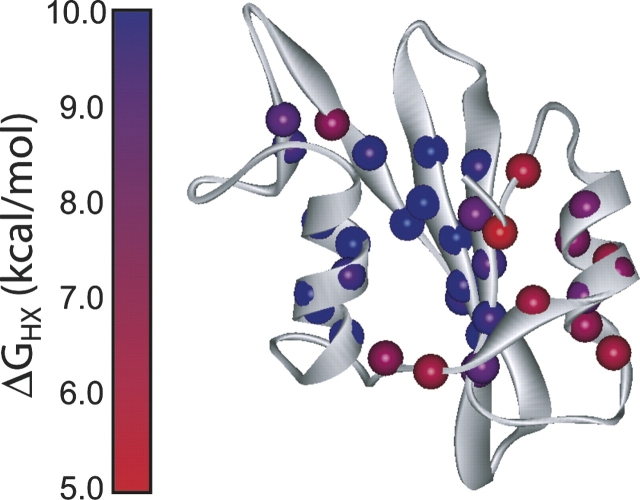
Figure 2.
Hydrogen exchange protection factors in Src SH2 in 0 M urea. Amide groups with measured exchange rates are shown as spheres, colored from red to blue according to the magnitude of the protection factor. Ribbon diagram is generated from the Protein Data Bank file 1spr (Waksman et al. 1993).

