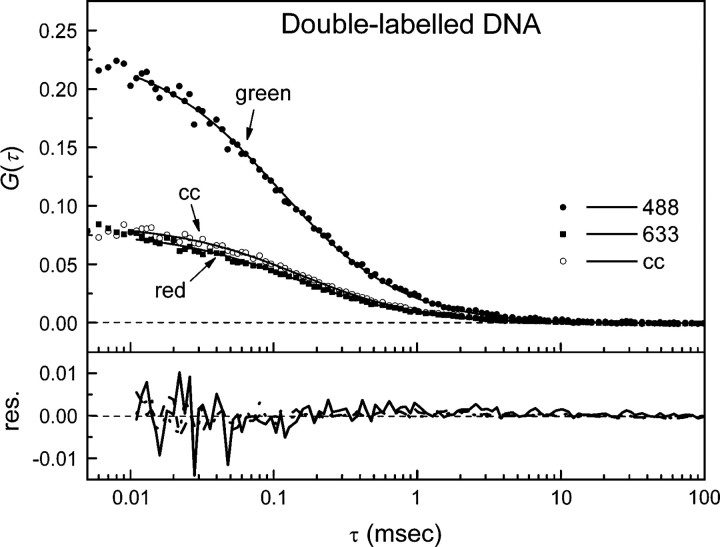
Figure 2.
Autocorrelation curves of the double-labeled DNA. Shown are the autocorrelation curves of the AF488- (solid circle, solid line) and AF633- (solid square, dashed line) labeled oligomer and the cross-correlation curve (cc) (open circles, dotted line) to evaluate and calibrate the confocal setup. The curves were fitted using a one-species 3D-diffusion model (see residuals). Analysis showed that the cross-correlation efficiency was ∼80%.

