Figure 3.

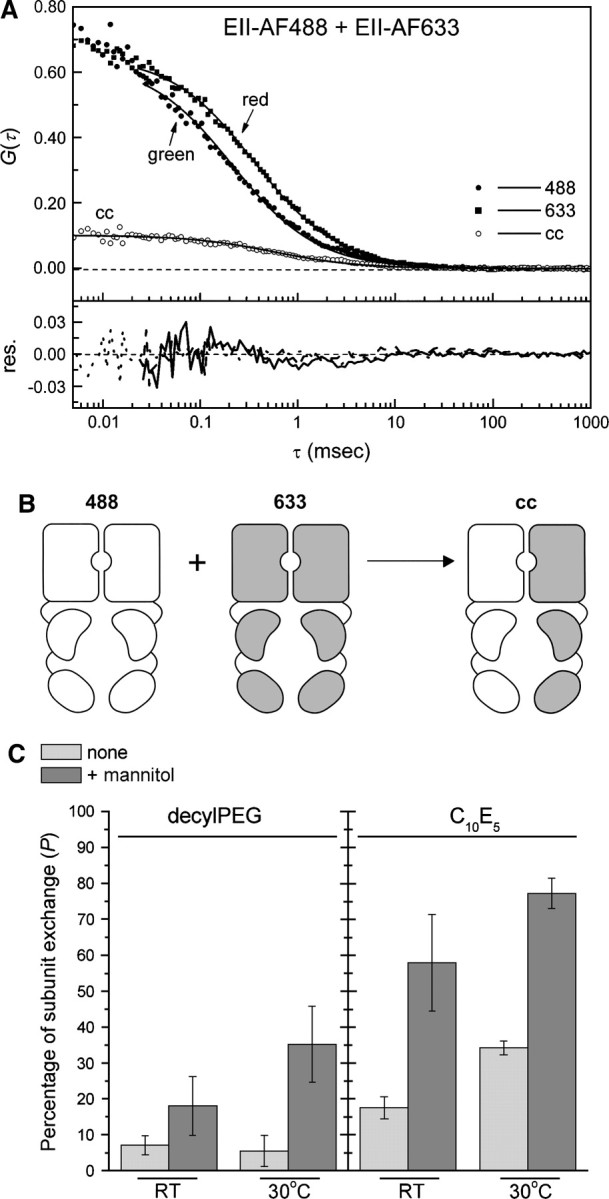
Effect of the buffer system on the subunit exchange between EII-AF488 and EII-AF633 homodimers. (A) Autocorrelation curves of mixed EII-AF488 and EII-AF633 and the cross-correlation curve. The protein samples (nanomolar concentrations) were prepared in a C10E5-containing buffer supplemented with 1 mM mannitol and incubated for 20 min at 30°C, after which the FCCS measurements were started. The quality of the one-species 3D-diffusion model toward which the data were fitted is shown by the residuals. (B) Schematic of the subunit exchange between homodimers 488 and 633, resulting in heterodimer cross-correlation. (C) Mixtures of 25 nM EII-AF488 and EII-AF633 were prepared in either a decylPEG or C10E5-containing buffer, in the absence (light gray) or presence (dark gray) of 1 mM mannitol and incubated for 20 min at either RT or 30°C, after which the FCCS measurements were started. The maximal amount of cross-correlation was calculated as described in Materials and Methods. The error bars represent the standard deviation of three to six individual measurements.
