
Figure 2.
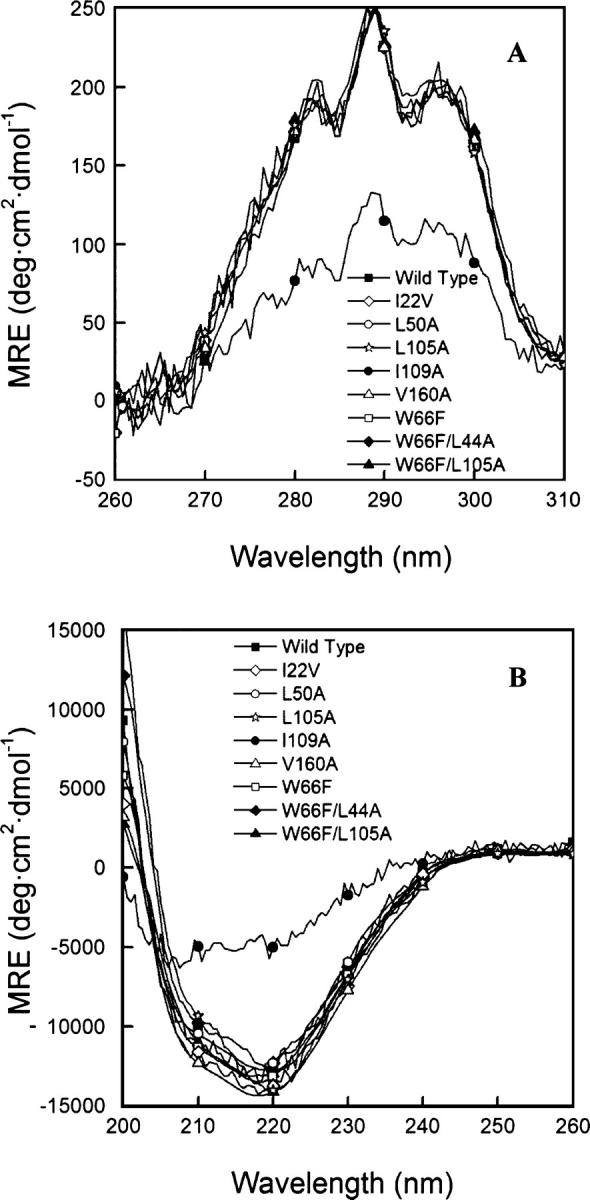
Circular dichroism spectra of wild type and some of the mutants analyzed (see Campos et al. 2004a for the rest of the mutants) at 25.0° ± 0.1°C. (A) Near-UV, in 50 mM MOPS (pH 7.0). (B) Far-UV, in 5 mM MOPS (pH 7.0), with 15 mM NaCl. Signals of the W66F mutant (and derived) are shown normalized, for the sake of comparison.