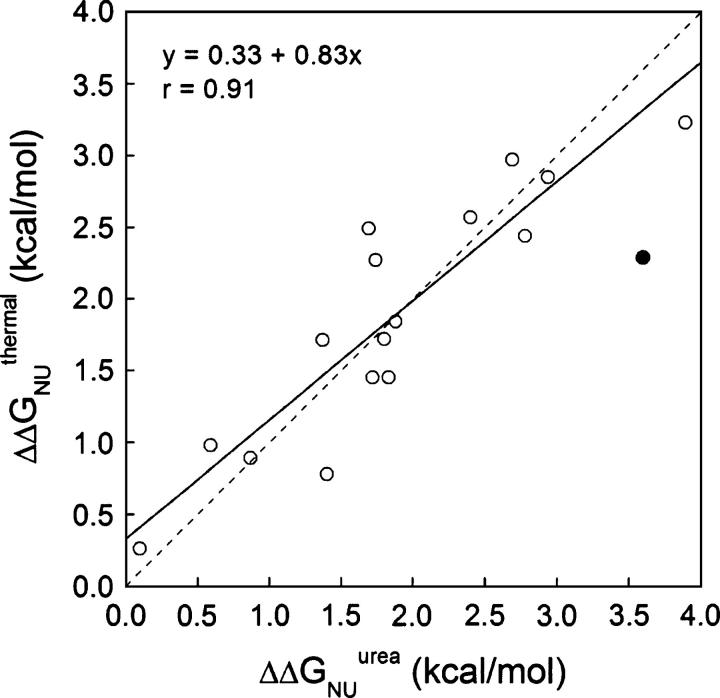
Figure 4.
Comparison of ΔΔGNU values obtained for wild-type apoflavodoxin and mutants thereof by adding the ΔΔGNI and ΔΔGIU terms calculated from global analysis of three-state thermal unfolding curves (Table 3) with those directly measured from two-state urea denaturation (Table 1). The filled circle represents data from mutant I156V, excluded for the correlation due to possible structural relaxations (see text). The dotted line is a unity fit.

