
Figure 4.
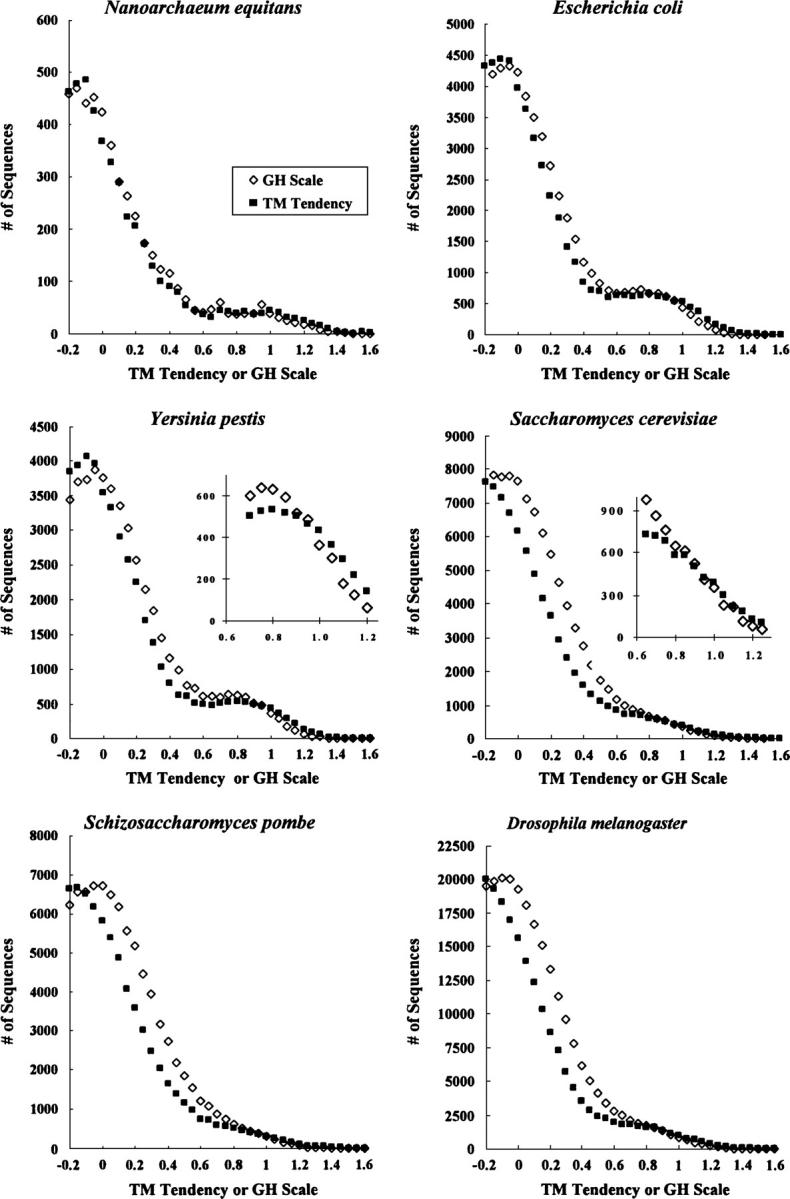
Comparison of the abundance of sequences as a function of “hydrophobicity” in various individual genomes as estimated by the GH scale and TM tendency scales. The total genomic abundance of sequences versus hydrophobicity is shown for the GH scale (open diamonds) and TM tendency (closed squares) scale for Nanoarchaeum equitans, E. coli, Y. pestis, S. cerevisiae, Schizosaccharomyces pombe, and Drosophila melanogaster. A sliding window size of 19 and a merge factor of 4 were used. Each point represents sequences with a hydrophobicity value range from equal up to <0.05 units greater than the hydrophobicity value shown on the X-axis. Insets show expanded portions of selected graphs.