
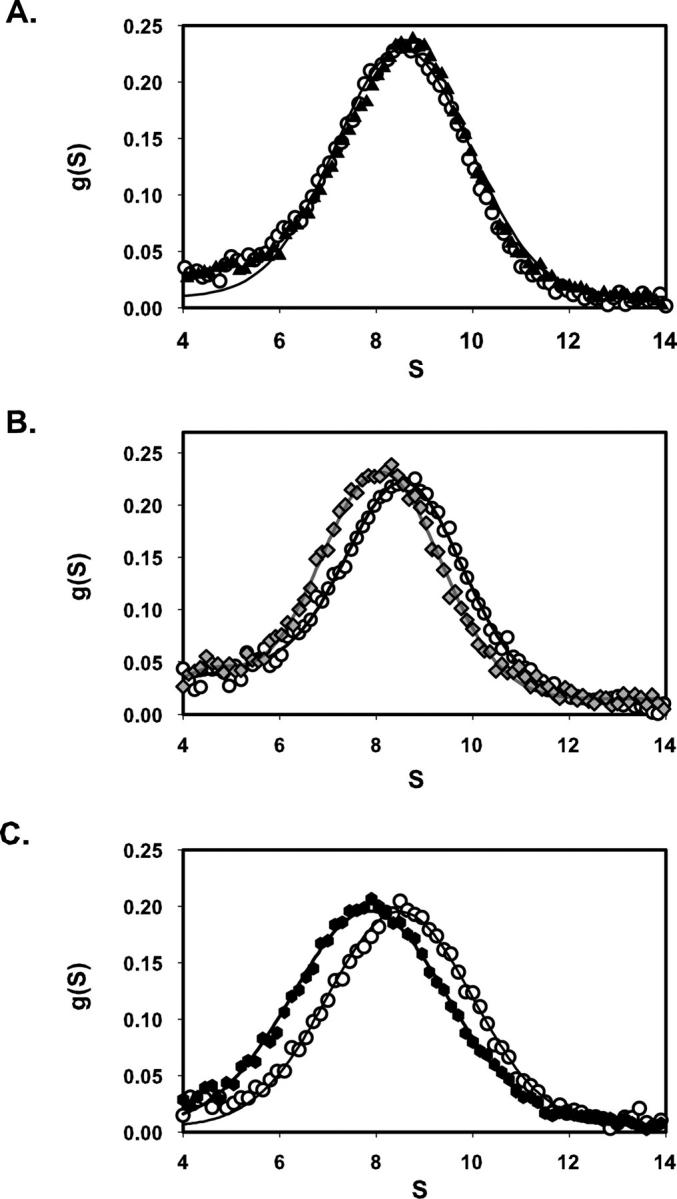
Figure 2.
Effects of recombinant echistatin variants on the distribution of αIIbβ3 sedimenting species, g(S) versus S (time-derivative software; DCDT+; Philo 1997). Each panel compares the distribution obtained with ligand-free integrin (open circles) to a paired sample containing excess echistatin variant. Continuous lines were obtained by fitting the resultant distribution functions to a one- or two-species model, as required. (A) rEch (1–49) M28L D26A (black triangles). (B) rEch (1–49) M28L R24A (gray diamonds) (C) rEch (1–49) M28L D27W (black hexagons).