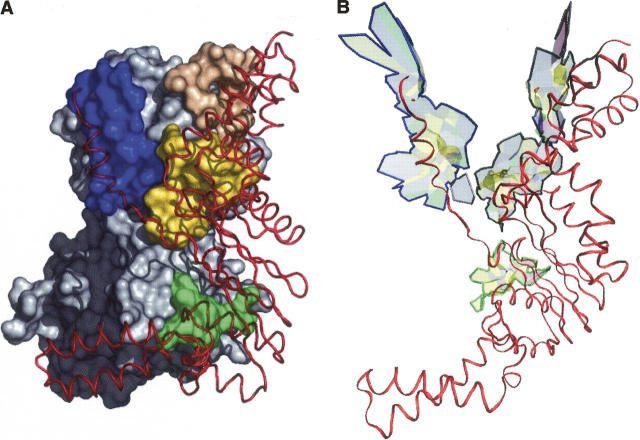
Figure 4.
Interface connectivity: patches and scc. The Escherichia coli EF-Tu/Ts interface is split by the geometric clustering procedure of Chakrabarti and Janin (2002) into four patches, but it contains only three scc. (A) The patches are in different colors on the molecular surface of EF-Tu. (B) Heavy lines mark the edges of the three scc. EF-Ts is drawn as a red ribbon in both panels.

