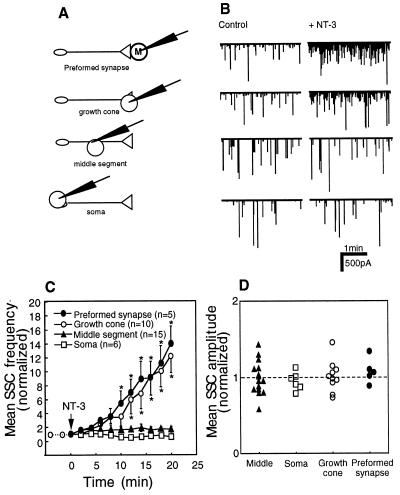
Figure 1.
Acute effect of NT-3 application on SSC frequency at different axonal segments. (A) Schematic diagram of recording configurations. Whole-cell patch-clamp recordings were performed from the myocytes (M) at the spontaneous formed (“preformed”) synapses and from myocytes manipulated into contact with the growth cone region, the middle axonal segment, and the soma of isolated neurons 1 day after cell culture preparation. The neurons chosen for manipulation experiments were free of contact with other cells and had a single axon ≈300–400 μm in length. (B) Membrane currents recorded from the myocytes for a 3-min period before NT-3 application (“control”) and for a period of 15–18 min after the onset of NT-3 (50 ng/ml) treatment. Downward spikes are inward currents reflecting spontaneous ACh secretion from the neuron. (C) Changes in the SSC frequency with time after the bath application of NT-3 (marked by arrow). The mean SSC frequency was calculated for 2-min intervals and normalized to the mean SSC frequency for a 5-min period before NT-3 application. Each data point represents the mean ± SEM of 5–15 experiments. ∗, significantly different from control values (P < 0.05). (D) Changes in the mean SSC amplitude after bath application of NT-3. In each recording, the mean SSC amplitude was determined 20–25 min after NT-3 application and normalized to the mean SSC amplitude before NT-3 application.

