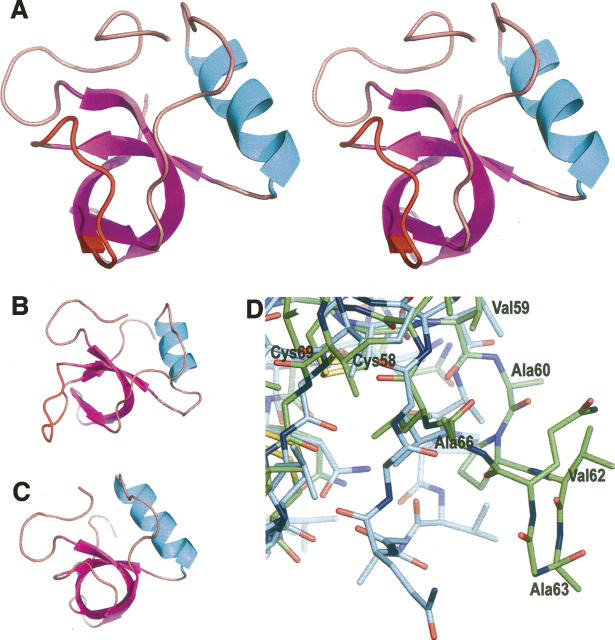
Figure 1.
(A) The structure of HFBI, molecule A, in stereo. The α-helix is in cyan; β-strands, in purple. The region of the structural change in the HFBI structure is highlighted in red. (B) HFBI, molecule B, showing different conformation compared to molecule A. (C) HFBII, molecule A. (D) Superimposition of molecules A and B of the native HFBI on the area of the structural change. Molecule B is in green.

