
Figure 4.
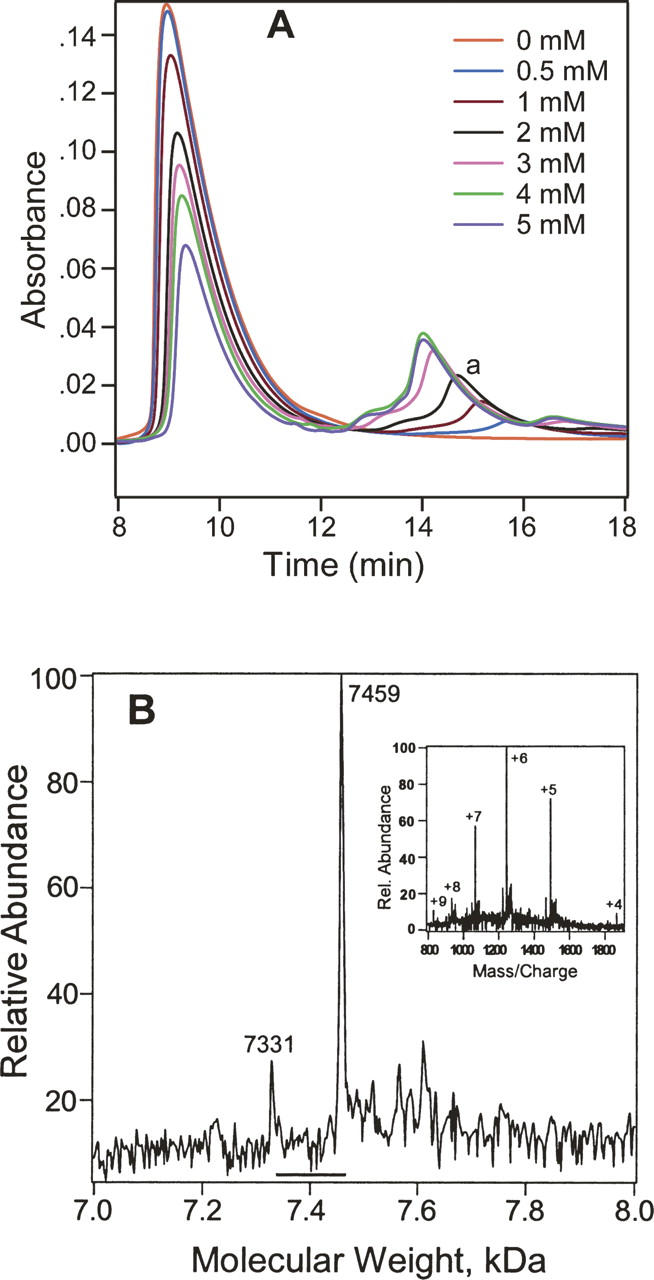
Concentration-dependent photolabeling of PKCδ C1A. (A) HPLC traces of the PKCδ C1A photolabeled at various concentrations of 3-azioctanol. The stated concentrations of 3-azioctanol were incubated with 0.14 mM PKCδ C1A for 20 min, photoirradiated for 30 min, and analyzed by HPLC. Unmodified PKCδ C1A is the large peak on the left. PKCδ C1A-azioctanol photocomplex is indicated as “a.” (B) The deconvoluted mass spectrum of the PKCδ C1A-azioctanol complex. Fractions (14–16 min) corresponding to the 1 mM (Fig. 4A) trace were collected, concentrated, and infused into the mass spectrometer. The small peak at 7331 Da is the mass of unchanged PKCδ C1A, and the large peak at 7459 Da has a single azioctanol incorporated. (Inset) The corresponding charge envelope.