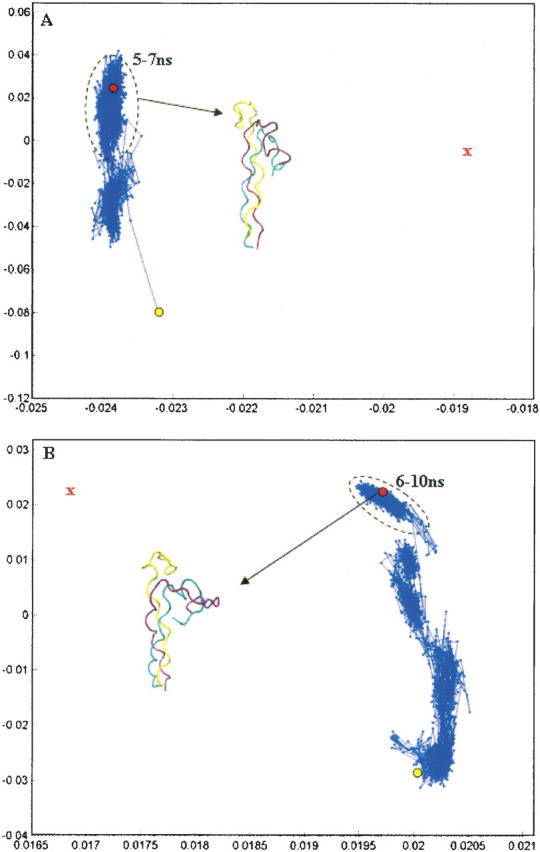
Figure 2.

Principal component analysis of folding trajectory for peptide 1 using the implicit solvent model GBSW with α = 0.0005 kcal/mol-Å4 (A) and α = 0.005 kcal/mol-Å4 (B). The red X denotes the approximate position of the target structure. Structures corresponding to the last 2 nsec of the trajectory are outlined with a black oval in A and structures from the last 4 nsec of the trajectory are outlined in B. We note that, for these simulations, more than 99.5% of the variance in structural positions is accounted for by the first two components, suggesting that this representation is an adequate picture of the overall folding pathway. The initial and final structures from the folding trajectory are explicitly shown.
