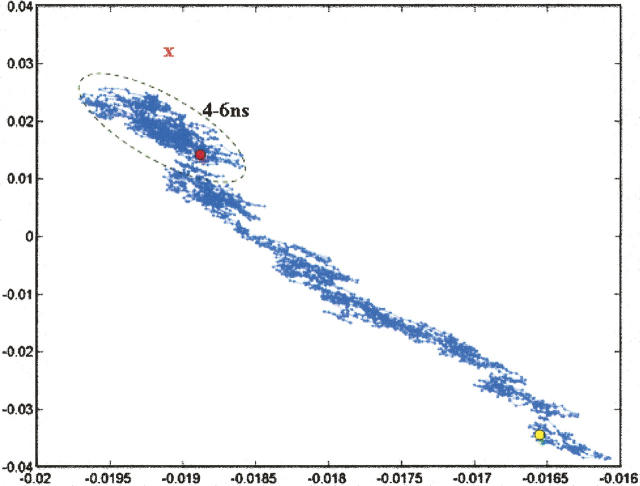
Figure 3.
Principal component analysis of peptide 1 folding trajectory. Three thousand structures (1 every 2 psec) is projected onto the first two principal components to produce a two-dimensional plot of the trajectory. The yellow circle denotes the position of the starting unfolded structure, and the red circle denotes the position of the final structure after 6 nsec. The red X denotes the position of the target structure. Structures corresponding to the last 2 nsec of the trajectory are outlined with a black oval. We note that, for this simulation, more than 96% of the variance in structural positions is accounted for by the first two components, suggesting that this representation is an adequate picture of the overall folding pathway.

