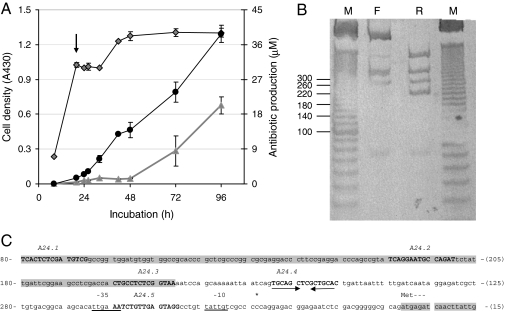
Fig. 2.
T7 exonuclease/DNase I mapping of candidate regulatory motifs within the promoter of actII-orf4. (A) S. coelicolor M145 mycelium was harvested from a culture grown in rich R5 medium at a time point (indicated by arrow) preceding visible actinorhodin production. Cell growth (diamonds) and production of actinorhodin (triangles) and undecylprodigiosin (circles) were monitored throughout. (B) Boundaries were mapped on both strands, as described in Fig. 1, and their positions were determined after size analysis by 12% nondenaturing PAGE, followed by chemoluminescent detection of DIG-labeled products. A 10- to 1,000-bp marker (lane M; sizes shown on the left of the gel) was used to determine the sizes of protected bands derived from the forward (F) and reverse (R) orientations. (C) Sequence of the actII-orf4 promoter showing the positions of the putative cis-regulatory elements (relative to the primers used in the mapping protocol). Boxed areas indicate the coding sequences of the upstream gene (actII-orf3) and of actII-orf4. Capitalized sequence marks the candidate regulatory elements with their names shown above. The underlined sequences indicate the −35 and −10 boxes for the actII-orf4 promoter, the asterisk shows the position of the transcriptional start site, and the convergent arrows indicate the inverted repeat present in A24.4. The sequence is numbered on the left side as distance downstream of the forward primer used in the PCR, and on the right, distance upstream of the reverse primer.

