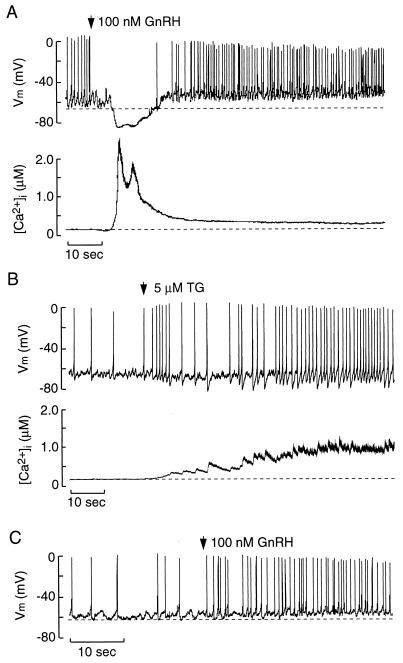
Figure 1.
Store depletion and membrane excitability in GT1 cells. (A) Simultaneous measurements of membrane potential (Vm) and [Ca2+]i in GnRH-stimulated cells. (B) Simultaneous measurements of Vm and [Ca2+]i in TG-treated cells. In A and B, perforated-patch recording techniques were used. (C) AP firing in GnRH-stimulated cells with [Ca2+]i clamped at ≈20 nM, using conventional whole-cell recording techniques. Arrows indicate the moment of application of GnRH and TG. In this and the following figures, dotted lines represent baseline potential (upper tracing) and basal [Ca2+]i (bottom tracing).

