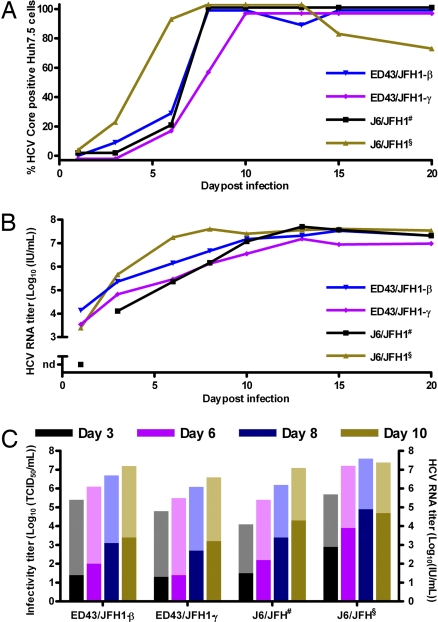
Fig. 2.
Comparison of infection kinetics of serially passaged J6/JFH and ED43/JFH1 viruses. Huh7.5 cells were incubated for 6 h with ≈103 TCID50 (MOI = 0.003) first-passage J6/JFH# or third-passage J6/JFH§, ED43/JFH1-β or -γ. (A) Percentage of Core-positive cells. (B) HCV RNA titers in culture supernatants monitored by HCV TaqMan. nd, not detected. (C) Supernatant infectivity titers determined by TCID50 assay (dark colored columns). RNA titers are shown for comparison (light colored columns).

