
Figure 1.
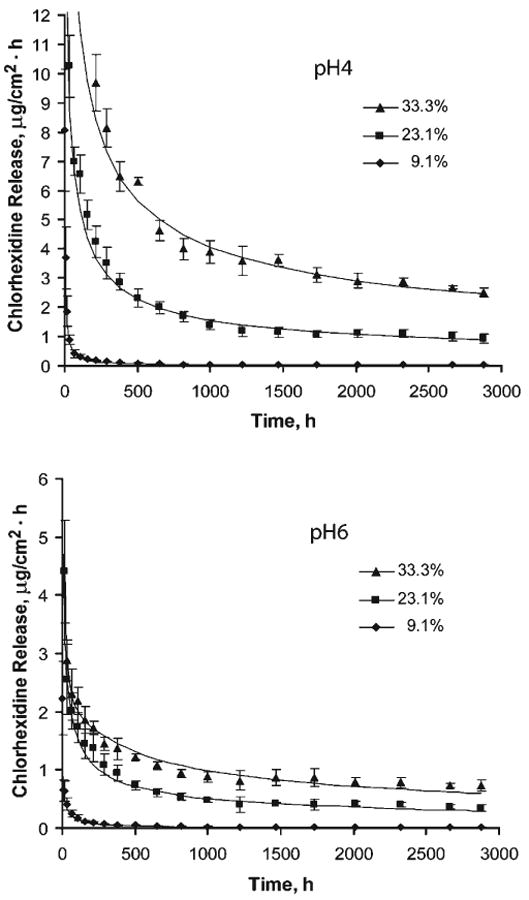
Mean chlorhexidine release rate (μg/cm2·hr) as a function of time from filled resin specimens containing 9.1, 23.1, and 33.3 wt% of chlorhexidine diacetate in pH 4 (left) and pH 6 (right) buffer solutions. Each datapoint is the mean of release rates (n = 10) between consecutive measurements, and the error bars represent ± 1 SD of the release rates. The release rates above 12 μg/cm2·hr in pH 4, and 6 μg/cm2·hr in pH 6 buffer solutions are not shown, as a better illustration of the release rate at later times. The datapoints that appear to overlap the baseline of the plots represent a mean release rate less than 0.1 μg/cm2·hr. The solid line represents the release rate vs. time based on the best-fit curve of the equation of the respective group. We obtained it by substituting the values of coefficients in Table 1 into the first derivative of the equation with respect to time, and plotting the rate over the entire experimental period.