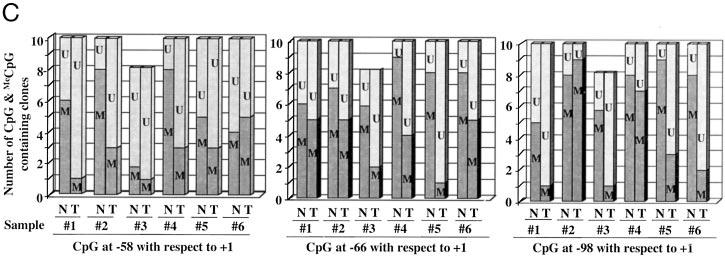
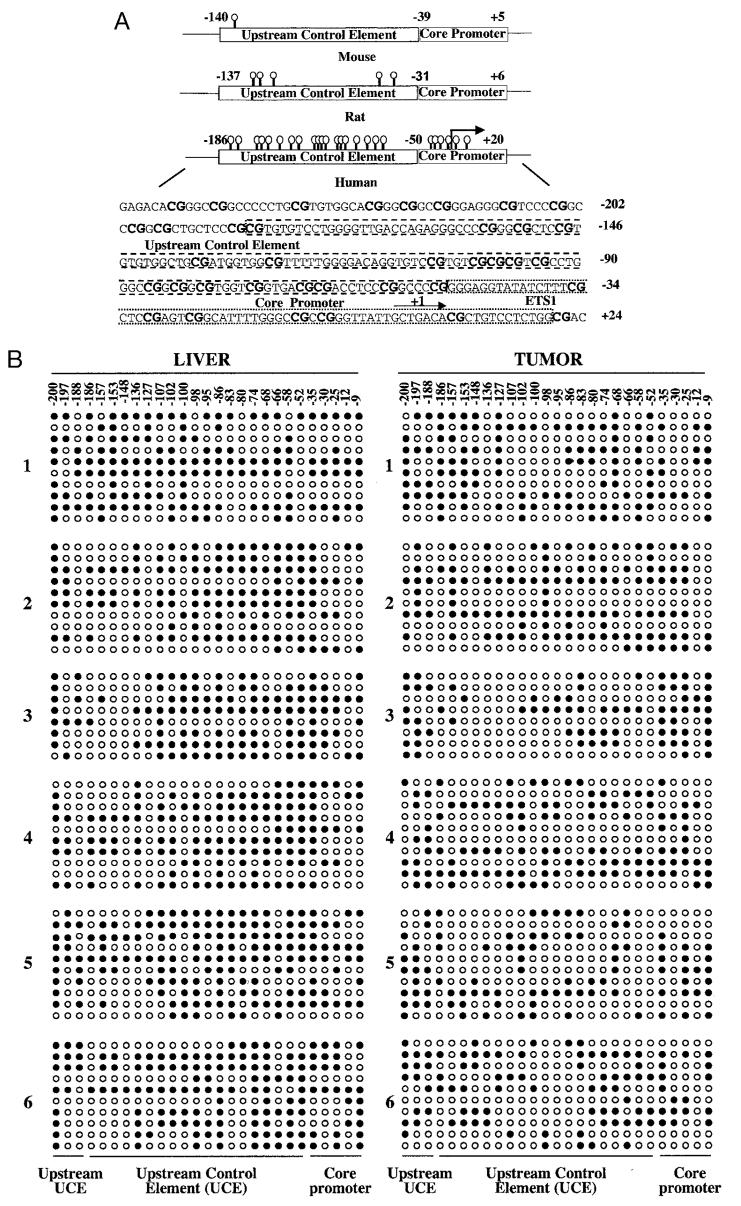
Fig. 1.

A, schematic depiction of the CpG dinucleotides on rRNA promoters in humans, rats, and mice (not drawn to scale) and the location of CpG dinucleotides (represented as lollipops) spanning the promoter region of human ribosomal RNA. B, methylation status of each CpG base pair spanning −200 to −9 bp of human rRNA promoter in six human hepatocellular carcinomas and matching livers. Ribosomal RNA promoter region was amplified from bisulfite-treated genomic DNA and cloned in TA vector (Invitrogen), and 8–10 clones, randomly selected from each sample, were subjected to automated sequencing. Each row represents the sequence of an individual clone, whereas each column depicts the position of the CpG. The filled and open circles denote methylated and unmethylated CpGs, respectively. C, quantitative analysis of methylation density at −58, −66, and −98 bp with respect to the +1 site of the rRNA promoter in individual tumors and matching livers. The number of clones methylated and unmethylated at these positions among 10 clones (eight for sample 3) is represented in this bar diagram. N and T denote livers and hepatocellular carcinomas, whereas U and M indicate unmethylated and methylated CpGs, respectively.

