
Figure 4.
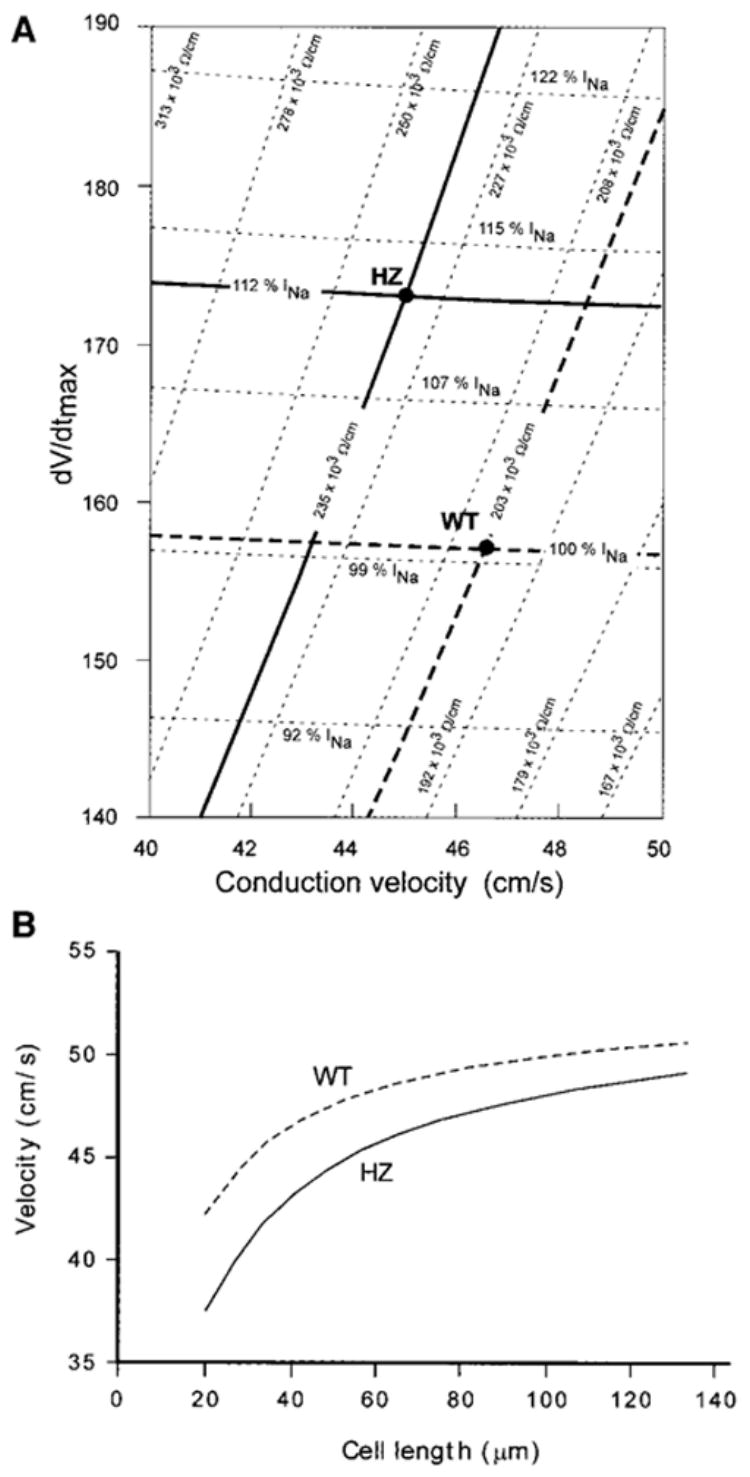
A, Simulation of the relationship between dV/dtmax of the action potential upstroke and conduction velocity in a myocyte strand having a cell length of 40 μ m. Bold dashed lines cross at a point in the “dV/dtmax velocity phase space” that corresponds to the experimental data in the WT strands. Simulating conduction without changing INa, but with a 43% reduction of Cx43 expression yields an almost unchanged dV/dtmax, at a velocity of 43.2 cm/s (crossing of the bold horizontal dotted line with the oblique bold solid line). A fit to the experimentally determined HZ values (crossing of the bold solid lines) is only possible by an upregulation of INa by 12%. B, Simulation of the effect of cell length, l, on conduction velocity, θ, in WT murine synthetic strands (top curve) and HZ strands (bottom curve). Simulation was initiated from the fit to the experimental data at l = 40 μ m. Note that increasing l has two effects: it increases θ and it reduces the effects of a difference in Cx43 expression between WT and HZ.