
Figure 1.
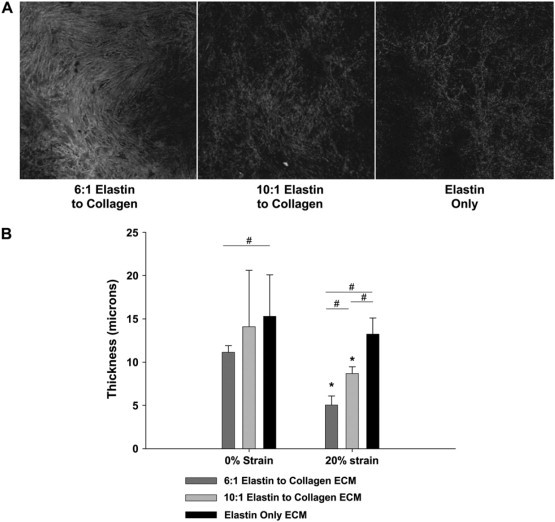
(A) Confocal image examples of autofluorescence taken from the bottom layer of each of the three ECM sheet types while still encased in gelatin. (B) The average thickness data for all three ECM sheet groups at 0% strain (left) and ∼20% strain (right). The asterisk denotes a significant difference compared to 0% strain (p < 0.05). The pound sign denotes a significant difference between groups at a given strain (p < 0.05).