
Figure 4.
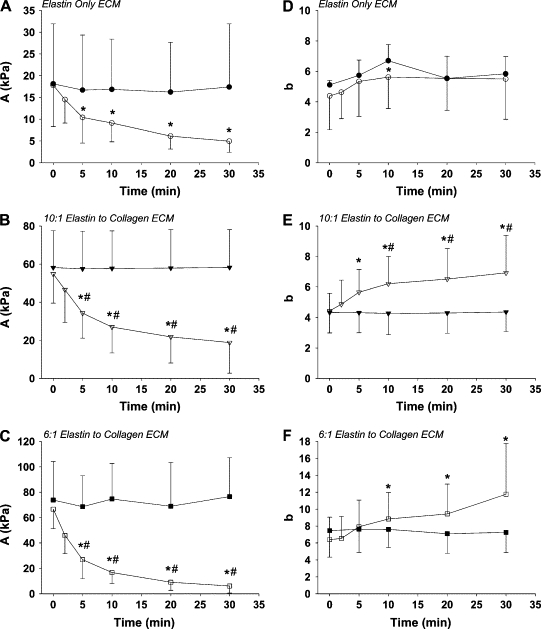
Time course of the mean ± SD of the amplitude parameter A and the nonlinearity parameter b for the control (solid shapes) and elastase-digested (open shapes) samples. Panels A–C display A-values for the EO, EC10, and EC6 groups, respectively. Panels D–F display b-values for the EO, EC10, and EC6 groups, respectively. The asterisk denotes a significant difference within group compared to the value at 0 min (p < 0.05). The pound sign denotes a significant difference between digested and control samples at a given time point (p < 0.05).